Context – Energy – Oil
Contents
- Oil Characteristics
- Oil Consumption – historic and future
- Net Zero by 2050?
- Recent Update Posts and News – Links
Summary
- Oil is the most used energy source worldwide, predominantly for transport, providing 90% of transport power due to its high energy density.
- Oil percentage share of total energy market has declined as its use is centred principally on transport although actual consumption has increased steadily, particularly in Asia with growing populations and car ownership rates.
- The growth of electric vehicles (EVs) has been both large scale and rapid, particularly in China and exceeded 20% of total global market in 2024.
- The future for oil will directly depend on the speed and extent EVs uptakes.
- To achieve ‘Net Zero’ by 2050, oil demand must fall by 20% by 2030 and by a total of 78% by 2050.
- Net Zero by 2050 is essential to keep the climate within what has been indicated as ‘safe’ heating limits of 1.5 to 2 degrees of warming.
- This also requires that EVs share of the new car market increases to 65% in 5 years to 2030 and to 100% of new cars sold by 2035.
- Political resistance led by President Trump and the removal of subsidies for EVs will make this a challenge but China and much of the rest of the world remains committed to their stated goals for EV expansion.
1. Oil Characteristics
Extracts from: https://understand-energy.stanford.edu – Oil Fast Facts.pdf – Google Drive (emphasis in orange added):
‘Fast Facts About – Oil
Principal Energy Use: Transportation Form of Energy: Chemical.
Oil is the most-used energy resource worldwide and provides more than 90% of global transportation energy. Because the majority of oil is produced by a limited number of countries, securing access to this resource has significant geopolitical consequences.
Oil (also referred to as petroleum) is a depletable, non-renewable resource burned to convert chemical energy into heat, and a leading contributor to air pollution and climate change. It is a mixture of hydrocarbons found mostly in liquid form in porous rocks beneath the Earth’s surface. The process to extract and produce oil involves prospecting, drilling, completion, and production. Various refined products (e.g., gasoline, diesel, jet fuel) are obtained from processing crude oil, an energy-intensive process.
Because of its high energy density, both by weight and volume, oil is very convenient for transport (where you have to carry your fuel with you). This makes it difficult to replace oil with less energy dense low-carbon alternatives.
Oil-Fueled Transportation Energy Systems are Highly Inefficient
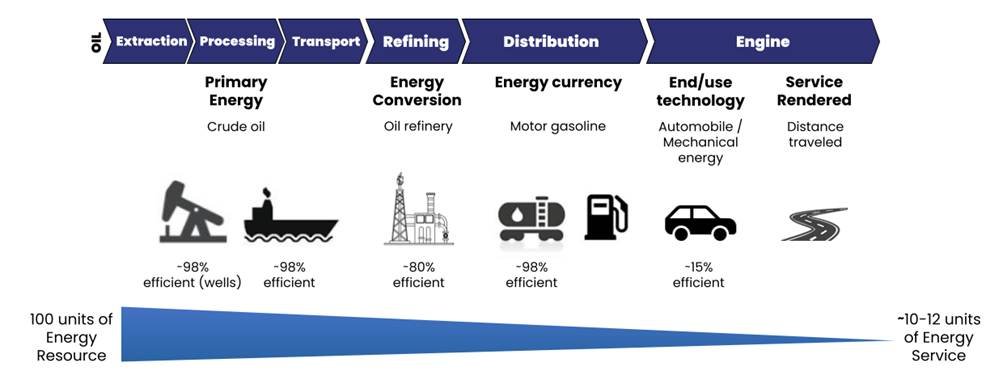
- Oil production and refining processes are relatively efficient. Only 25% of production is lost between the well and the fuel pump
- 86% of the fuel put into an automobile never reaches the wheels. It is lost to engine and driveline inefficiencies, or used to power accessories
- Less than 1% of the car’s fuel moves the driver
Significance
| Energy Mix 32% of world (#1 resource) | Electricity Generation 2% of world (#7 resource) | Transportation Energy 91% of world | Change in Global Consumption – Virtually no change: ⬆ 0.2% (2017-2022) |
Oil Use is a Significant Contributor to Global Energy GHG Emissions (and the Biggest Contributor to US Energy GHG Emissions)
33% of world (41% of US) energy GHG emissions are from oil (includes methane leakage).
Energy GHG emissions are ~75% of global GHG emissions.
(Visit our Natural Gas page for more information on methane leakage)
Oil Use for Transportation Is a Major Contributor to Outdoor Air Pollution
Adverse health effects from vehicle exhaust include cancer, cardiovascular disease, respiratory diseases, diabetes mellitus, obesity, and reproductive, neurological, and immune system disorders.
Particulate matter smaller than 2.5 microns (PM2.5) emissions pose the greatest risk to health. Other pollutants include carbon monoxide (CO), nitrous oxides ( NOx), and ozone (O3). Transport contributes 8% of global and 17% of US PM2.5 emissions.
Vehicle electrification reduces air pollution and its health effects because most of the exposure is in highly dense urban areas with heavy traffic.
World
| Largest Proved Reserves Venezuela -18% of global proved reserves | Largest Producer US -19% of global production | Largest Consumer US – 20% of global consumption |
Global Trade (Crude Oil)
| Total Traded 73% of global production | Largest Exporter Saudi Arabia 17% of crude oil exports | Largest Importer China 24% 🇨🇳 Europe 24% of crude oil imports | Leading Refiners US 18% 🇺🇸 China 17% 🇨🇳 of petroleum product output (gasoline, jet fuel, diesel, etc.) |
Drivers
- High energy density in volume and weight of oil; easy to store and transport
- Few alternatives for transport, especially long-haul trucking, shipping, and aviation – [added: but China proving the power of major transition to electric vehicles is possible and happening ]
- Established infrastructure (e.g., fuel stations, refineries, manufacturing plants)
- Social and environmental externalities are not accounted for in price
- Corporate lobby with political influence
- Innovation in extraction drives down costs and increases available resource (horizontal drilling, hydraulic fracking)
- Global and US economies are very dependent on oil [added – major issue for transition]
- Desire to maintain economic and political power by exporting countries, including OPEC+
Barriers
- Many externalities: oil spills, air pollution, methane leakage, CO2 emissions, water use and contamination, land use
- Depletable, non-renewable resource
- National security: geopolitical conditions disrupt supply and price
- Inefficient; significant losses from well to moving people
- Public health: GHG emissions, SOx, NOx, etc. impacts near wells, refineries, and pipelines; past use of leaded gasoline
- Legacy infrastructure and pollution issues with abandoned wells and closed refineries
Climate Impact: High

- Carbon dioxide is released during combustion
- Methane leaks during extraction and production
Environmental Impact: High

- Ecosystem disturbance from exploratory wells, road construction, seismic techniques of exploration during prospecting
- Significant land impacts, habitat destruction, and water contamination during extraction
- Groundwater and soil damage from improper disposal of saline water pumped from the ground and oil and gas leakages from improperly maintained wells
- High energy and water requirements for extraction and refining
- Irresponsible oil production can lead to seismicity
- Oil spills
Air pollution from combustion (NOx, SO2, particulate matter, volatile organic compounds)
Sources Printable PDF, 249 KB Updated March 2024’
2. Global Oil Consumption – historic and future trends
(all charts from https://ourworldindata.org unless otherwise stated)
Historic –
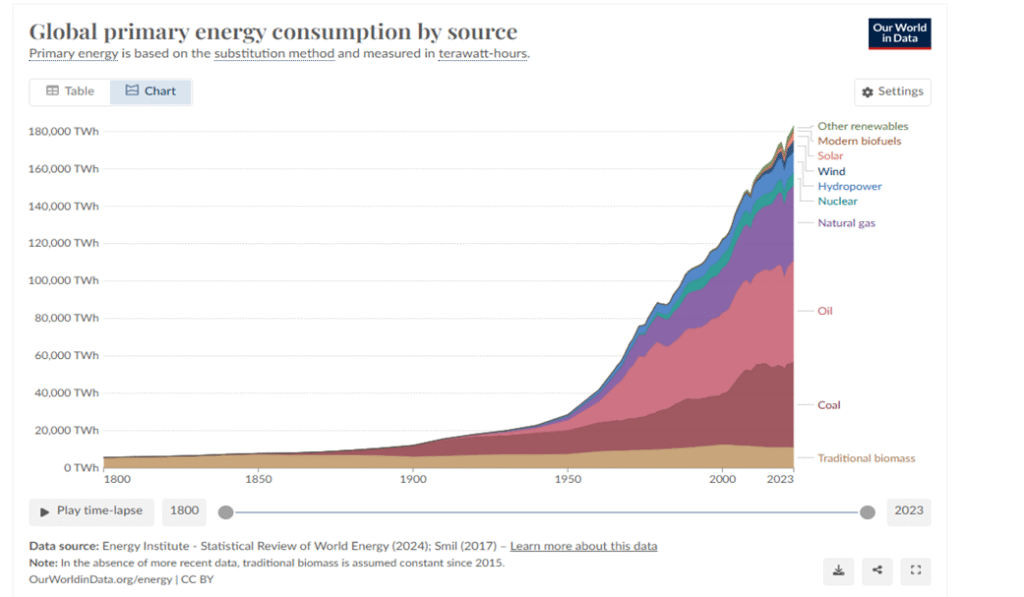
- As may be seen from the above chart; oil consumption (like all other fossil-based energy sources) has been on a steep growth over the past 75 years approximately with oil consumption growing from 5,500TWh in 1950 approximately to 32,000TWh in 1975 (x6), but rate of growth has slowed significantly since then: 42,000TWh in 2000 and 54,000TWh in 2023 .
- In 1950 oil consumption represented 19% of total primary energy consumption, by 1975 that share had jumped to 41.6% due to cheap oil use to that time and its use in electricity generation which then scaled back massively due to the oil price shock of the early 1970s, as reflected in the figure of 34% of total consumption in 2000 (albeit of a much larger energy consumption pie in absolute figures as seen above) and declining gradually to 29% share of total energy consumption in 2023 but again with significant increase in actual consumption amounts.
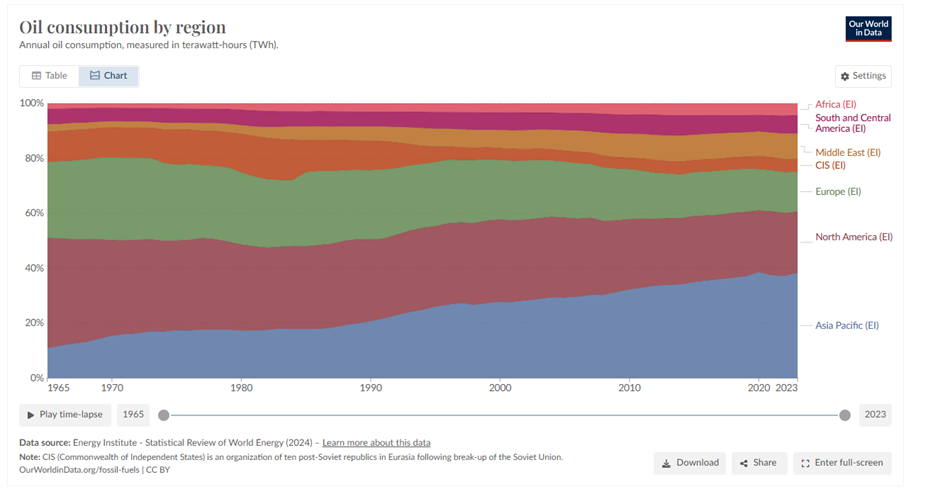
- What is notable from the above chart is the relative increase of the total consumption share in percentages of the Asia Pacific and Middle East regions as the total share for North America and Europe declined (although though those regions also increasing in absolute consumption terms). In 1990 Asia Pacific consumed 20.7% of the world oil total (North America 29.7% and EU 25%) but by 2020 that share had jumped dramatically to 38.5% for Asia Pacific, with North America falling to 22.5% and EU 15%. This reflects in part the significant population growth in Asia Pacific as well as the switch in developed countries from oil to natural gas electricity generation
Future Oil demand –
Following key points are derived from the International Energy Agency (IEA), World Energy Outlook 2024 (see also the analysis here for a review of the reports main findings).
- ‘Global oil demand increased by 2 million barrels per day (mb/d) in 2023 to 99 mb/d. This increase was nearly double the average annual increase between 2010 and 2019 and was led by increases in oil use as a petrochemical feedstock in China – where total oil demand increased by 1.5 mb/d – and by continued global growth in oil demand in the transport sector. Demand in advanced economies fell by around 0.3 mb/d.’
- ‘Oil demand trends in 2024 show a sharp slowdown in demand growth, notably in China, which is expected to result in an overall rise for the year of less than 1 mb/d.’ (section 2.1.1)
- Spare oil capacity – a reflection of how much supply relative to demand, spare capacity increased to 3 million barrels per day (mb/d) in 2019 which could rise further if OPEC increases production as indicated. This increase may reflect relatively weakening global demand in the near term (section 1.2.1). However actual prices are dependent on oil companies continuing to ‘manage’ supply to the oil market.
- Electric Vehicles – One key feature considered in the report is the continued growth of electric vehicles (EVs) connected to various national incentives in place particularly in China, EU and, up to the start of the Presidency of Donald Trump, in the USA. In energy terms, growing adoption of EVs means a shift from oil demand to electricity demand and the linking of transport and power sectors.
- ‘In 2023, 12% of all new cars sold worldwide were battery electric, almost 10% were internal combustion engine hybrids, and almost 6% were plug-in hybrids. EV market share, including battery electric and plug-in hybrids, reached 20% in 2024, with around 5% of passenger cars on the road being electric. By 2030, more than 15% of the global car fleet is electric, as is nearly one-in-two new cars sold in the STEPS scenario (ie scenario not new, government energy and climate policies worldwide). (section 3.3.1). In total numbers, EVs are anticipated to rise from 14 million today to over 40 million in 20230 and 60 million in 2035 (section 4.4.1)
- Oil Growth – The key IEA prediction is that oil demand growth continues to slow and will peak by 2030. This prediction remains the same for the second year running. By 2050 oil demand is predicted to be 6mb/d lower than in 2023 driven primarily by the shift to EVs in transport. (Section 3.5.1).
- Therefore the key uncertainty in the IEA predictions for oil demand relates its predicted rates of uptake for EVs. This is particularly the case with the termination of the EV mandate by the new US president and a review of the EU policy due in 2026 related to its commitment to terminate all fossil fuel based vehicles by 2035.
3. Net Zero by 2050?
Following key points are derived from the International Energy Agency (IEA), Net Zero Roadmap – A Global Pathway to Keep the 1.5C Goal in Reach, 2023 Update (NZE Report 2023)
- Under the NZE Report 2023, EVs and solar power provide 1/3 of the emissions reductions needed for Net Zero Emissions 2050 Scenario, up to 2030. This would require that the sale of EVs would soar to 65% of all new cars by 2030 (and solar increase 5 fold). This rate of transition would also lead to a reduction of 4GT of CO2 by 2030 (p66). This would require for oil and gas a drop of approximately 20% by 2030. (p55)
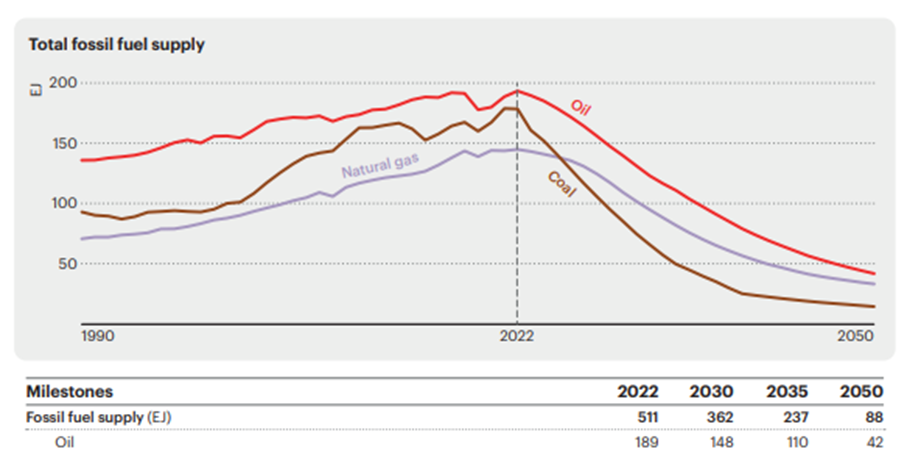
- As reflected in the following two graphs ( p93, p105); oil drops from 90% fuel in transport in 2022 to 80% in 2030 replaced by substantial amounts of biofuels and electricity and by 2050 represents only approximately 5% with electricity providing more than 90%.
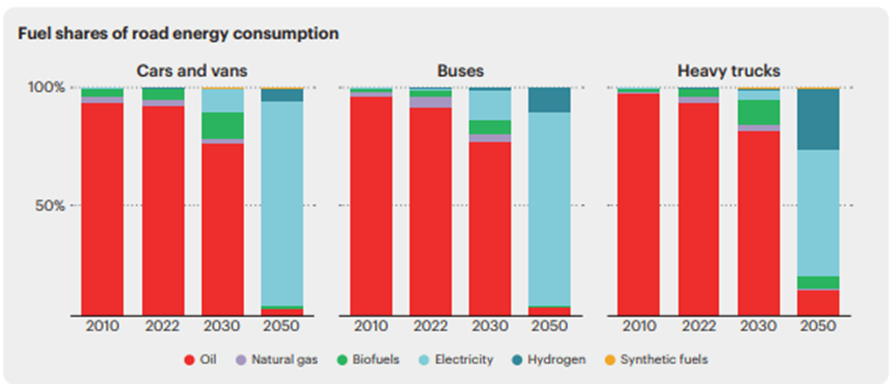
This switch from oil based to EV transport facilitates the reduction in demand for oil from 189EJ / 55,500TWh [Exajoules/ Tera-watt per hour: conversion rate: 1EJ = 277.778TWh] down to 148EJ ( 41,036TWh) by 2030, a drop of 26%, down to 110 EJ/ 30,556 by 2050; a further compound reduction of 25%, reaching 42EJ/ 11,667TWh; a total, fall of 147EJ over 25 years or 78% in the total period.
Renewables – Gap to NZ Transition –
- It is important to note that the IEA’s Net Zero 2050 Report is not, unlike its STEPS scenario, a prediction of outcomes in 2030 or 2050 but rather presents a feasible if very ambitious pathway to achieve a defined outcome; ie. net zero emissions by 2050 (with remaining emissions balanced by CO2 removal). Following is a brief outline of some main challenges faced in achieving that target both in the intermediate time periods of 2030, 2035 and 2040 as well as in the final phase to 2050.
- It will not come as a surprise that given the scale of transition required to meet the NZ emission targets outlined in the NZE 2050 report are not fully on track. But how big is the gap? Actually, for solar energy which is necessary for the clean energy uptake for renewable energy, the Energy Outlook Report notes the quadrupling of solar capacity over the past just five years to 425GW and manufacturing capacity can take that figure to 1,100GW. This is an essential step to ensure sufficient renewable energy capacity for the increase demand modelled for electric vehicles.
- However for oil, the transition to EVs is the crucial step required and there is, as noted above, some uncertainty in the speed of this transition. China accounts for nearly ¾ of the total increase in EV sales in 2024. However leaving China aside, sales are reported to have increased 10% overall including in new EV markets such as Brazil, Mexico and Indonesia in 2024 to 20% global total noted earlier. To go from 20% of all new sales to 65% electric vehicles in 5 years would require a mammoth effort of public policy, subsidies and broad public support. It is perhaps at a significant stretch achievable or close to that target if the demand is supported and maintained. Ultimately it is a straight race and switch required from oil to electric driven vehicles.
- The two IEA reports featuring in this analysis were written before the change in the US president and the cancellation of the EV mandate in the United States as well as President Trump’s oil promise to ‘drill baby drill’ and declaration of an energy emergency to deliver on that promise. What actual effect this has on the transition from oil to EVs both in the US as well as copycat effect in the rest of the world has yet to be seen but will be of major significance, at least in the short-term for the trajectory of the transition from oil to Electric Vehicles. But the speed of uptake to date for EVs as well as the renewables capacity to provide the clean electricity is a hopeful sign.
MCL – February 2025 (next update schedule: Spring 2027; more regular updates in the ‘Recent News Section’).