Context – Energy – Coal
(Note –All references used in the article are indicated and linked in the article. Direct quotations are indicated in italics – Emphasis highlighted in maroon. A Glossary of Energy Terms used in this article is provided here. )
Contents:
Summary
- Coal Characteristics
- Coal Consumption – historic and future
- Net Zero by 2050?
- Recent Update Posts and News Links
Summary
- Coal is the second placed provider for total global energy demand after oil and the first placed for electricity generation at over 2/3rd of all electricity, despite the recent rapid growth of renewables.
- Asia uses the most coal with China alone consuming almost two thirds of the global total.
- Coal is the most carbon intensive of all the fossil fuels by a substantial margin per unit of consumption. It also contributes 41% of total global CO2 emissions as well as a range of other environmental pollutants.
- The key attractions for coal is its abundance and is cheap to mine and burn. It is also a key component in heavy industrial processes, particularly cement and steel production.
- Falling demand in the ‘West’ is counter-balanced by rising demand in the ‘East’ but some evidence that overall demand has peaked.
- The early elimination of coal from electricity generation is a key component of being able to achieve Net Zero emissions by 2050.
- Net Zero by 2050 is essential to keep the climate within what has been indicated as ‘safe’ heating limits of 1.5 to 2 degrees of warming.
- This means more than halving in use by 2030 and a similar scale reduction by 2035 meaning more than 80% fall in 10 years.
- Not only must consumption fall steeply in a short period of time but that demand must be replaced by expanded renewables.
- Renewables are certainly expanding but whether it can replace the huge role of coal remains to be seen. It would need determined political support particularly in Asia and renewables is seen as a viable alternative. China, India and Indonesia are key countries in regards to that transition.
1. Coal Characteristics – Uses, Energy, Climate and Environmental:
Extracts from: https://understand-energy.stanford.edu – Coal Fast Facts.pdf – Google Drive (emphasis added):
Fast Facts About Coal
Principal Energy Uses: Electricity, Heat
Form of Energy: Chemical
Coal is the most carbon-intensive fossil fuel and a huge contributor to climate change, air pollution, and land disruption. It is a chemically complex, rock-like hydrocarbon that contains heavy metals (e.g., mercury and lead), sulfur, and radioactive material. Coal is mined from the Earth and burned to convert chemical energy to heat.
Mining, producing, and combusting coal all have significant impacts to human health and the environment. Additionally, underground coal mining has higher risk for miners than surface mining. While more widespread use of surface mining and machinery for underground mining have improved worker safety, some countries continue to use underground mining and rely on human labor.
A widely-available but non-renewable resource, coal is still the second-largest source of energy in the world and the most-used fuel for electricity generation. Its usage has been on decline in the US since its peak in 2007, but global coal use has continued to increase, primarily due to high demand in China, India, and Southeast Asian countries.
Significance
| Energy Mix | Electricity Generation | Global Coal Use | Change in Global Consumption |
| 27% of world (#2 resource) | 35% of world (#1 resource) | Electricity: 68% Heat: 20% Steel making: 13% | Increase: ⬆4% (2017-2022) |
Coal Use is the Biggest Contributor to Global GHG Emissions From Energy
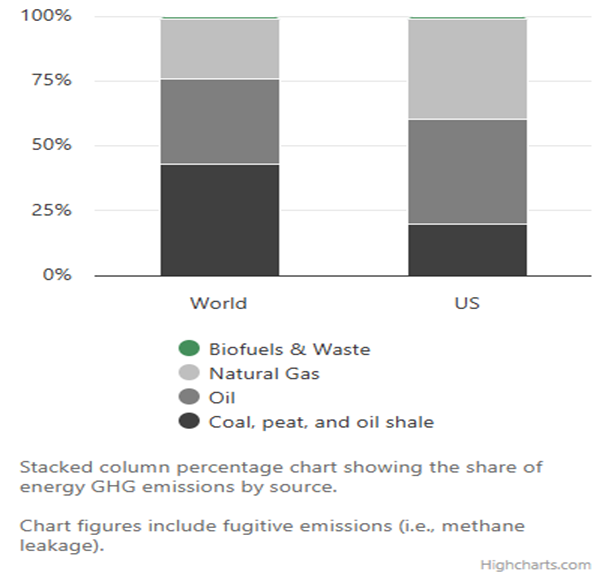
43% of world energy GHG emissions are from coal (includes fugitive emissions)
Energy GHG emissions are ~75% of global GHG emissions. Coal seams contain methane, which is released when the coal is mined. Coal Mine Methane (CMM) represented more than 10% of total methane emissions from human activity in 2022.
Coal Use is a Major Contributor to Outdoor Air Pollution
Coal combustion emits numerous hazardous air pollutants that impact human health and the environment.
Particulate matter contributes to human health impacts like asthma and respiratory illness. Particulate matter smaller than 2.5 microns (PM2.5) emissions pose the greatest risk.
Nitrous oxides (NOx) contribute to asthma, respiratory tract damage, and lung disease, and can lead to ozone which is harmful to human health.
Sulfur oxides (SOx) can harm the human respiratory system and can also cause acid rain. Hydrochloric acid (HCl) can cause acid rain.
Heavy metal (e.g., mercury and lead) toxicity can cause birth defects and damage the functioning of the brain, lungs, kidneys, liver, and blood composition.
World
| Largest Proved Reserves | Largest Producer | Largest Consumer | Amount Traded | Largest Exporters | Largest Importer | Amount Traded |
| US 22% | China 52% | China 55% | 16% of global use | Indonesia 34% Australia 25% | China 22% | Increase: ⬆6% (2017-2022) |
Drivers
- Abundant
- Relatively low private costs (but note that high social and environmental costs are not factored into the price)
- Easy to store
- Sunk cost of infrastructure
- Historical dependence of some communities on coal industry
- Domestic availability of coal
Barriers
- Many externalities: air pollution, methane leakage, CO2 emissions, heavy metals (e.g., mercury), coal dust, coal ash, water contamination, high water use, land subsidence
- Health and safety of mine workers; public health impacts on local communities
- Regulations are increasing
- New and existing coal plants are no longer cost competitive in many major markets
- Coal-fired power plants are inflexible, making it hard to integrate with increasing renewables
- Bankruptcy plaguing the US coal mining industry
- Legacy issues such as abandoned mines and leftover coal ash that require ongoing treatment and management
Climate Impact: High

- The most carbon-intensive energy source
- Escaping coal bed methane is also a potent greenhouse gas
Environmental Impact: High

- Combustion releases air pollutants (e.g., mercury, PM2.5, NOx, SO2)
- Extraction/mining and coal ash harm landscapes and water quality
- Surface mining and mountaintop removal are particularly damaging
2. Global Coal Emissions and Consumption – Historic and Future trends
(all charts in this section from https://ourworldindata.org unless otherwise stated)
Coal Carbon Emissions –
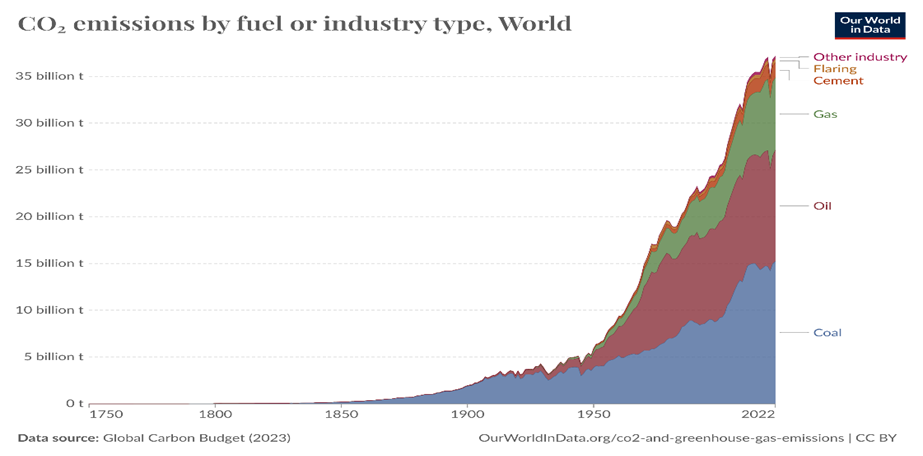
- Coal is the most carbon intensive of all fossil fuels producing an average of 97kg (depending on coal type) of CO2 per gigajoule (GJ) of energy (1 GJ = 277.8 Kilowatt per hour (kWh)). This is compared to crude oil which is 73kg CO2/GJ and natural gas which is 56kg CO2/GJ; almost half the intensity for the same amount of energy produced.
- In 2022, total CO2 energy related emissions were 37.15 billion tonnes or gigatonnes (Gt) of which the burning of coal accounted for 15.22Gt CO2, 40.96% of global total, the largest contributor of all fuel type showing the pivotal role that reduction of coal consumption must make in any effective transition towards zero carbon. Globally averaged, each person on earth produces 1.91 tonnes of CO2 from burning coal compared to 1.49 tonnes for oil and 0.97 tonnes for gas.
Consumption – Historic
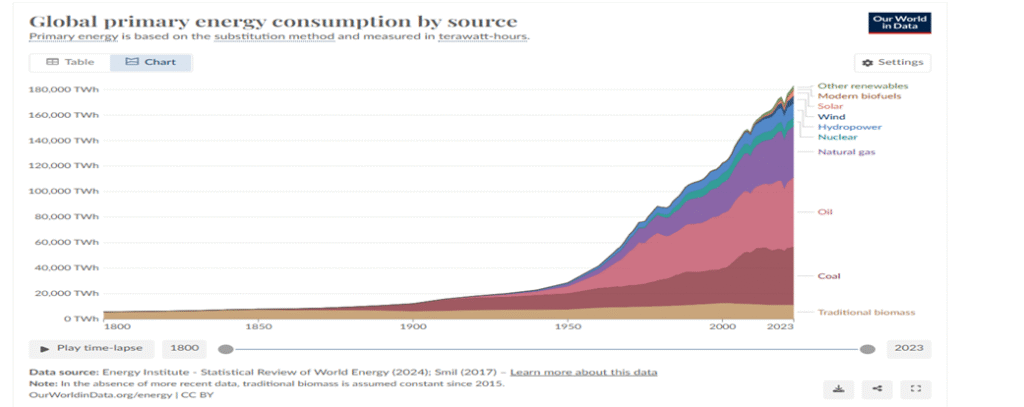
- As noted in the previous section, coal’s main and substantial advantage lies in its global abundance and affordability. It is these two factors that has meant that coal enabled the industrial revolution in the early 1800s in the age of steam and why it has retained its primary position even with the growth of oil in transport and methane (natural) gas for heating and electricity generation. This early predominance is reflected in the above chart as well as the scaled growth of coal (as well as oil and gas) as the demand for energy grow exponentially after World War 2.
- Coal in 1950 provided more ½ of all energy consumption (12,600 TWh). By 2000, coal consumption had grown over three times to 27,400TWh but with the advance of other fossil sources mainly, coal’s share slipped to approximately 1/3 of total energy supplied. By 2023, share of coal of all energy had slipped back to 1/4 of total energy as renewables started to feature more prominently in the energy mix.
Energy –
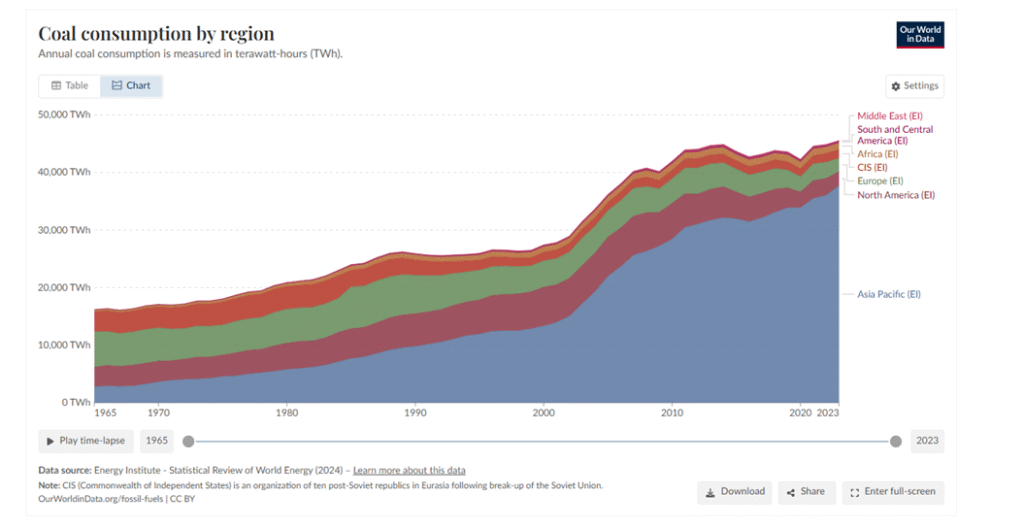
In 1980, the Asia Pacific region utilised a little over 1/4 of the total coal consumption with almost 3/4s consumed by America, Europe and the Soviet Union (CIS). By 2000, the former Soviet states consumption had dwindled as the Asia Pacific consumption grew to almost half of global total demand. This trend has continued to the present with total coal consumption in Europe and North America falling steeply (from 11,325TWh in 2000 to 4,780TWh in 2023). However this falling trend is more than made up by the rising electricity generation source in the developing countries of the Asia Pacific, growing from 13,350TWh in 2000 to 37,693TWh in 2023, more than trebling. The role of China has been critical in this development and for future trends with coal burning accounting for a massive 25,500 TWh of the global total (67.6% or exactly 2/3rds of total demand ) . The role of India as a fast developing Country is of similar population of over one billion people but coming from a much lower current baseline of 6,105 TWh of coal consumption (16.19%).
Industry –
As well as generation of electricity, coal is also used in heavy industry. In cement production, which accounts for almost 8% of global CO2 emissions, coal is used to heat kilns to temperatures in excess of 1,400℃. Green hydrogen and Carbon Capture and Storage have potential to reduce the emissions from coal but progress is slow. Steel is also heavily reliant on coal with 75% of global steel production using coal. Ways of dealing with the large emissions are similar cement by substitution, producing the high temperatures using ‘green’ gas and coal with carbon capture but again progress is again slow and could be decades before these alternative methods become mainstream according to the IEA.
Future Coal demand –
Following key points are derived from the International Energy Agency (IEA), World Energy Outlook 2024 (WEO) – see also the analysis here for a review of the reports main findings.
- The IEA analysis focuses on the expansion of renewables and the struggle for dominance between renewables and gas, in particular LNG (liquified natural gas) rather than with coal. For coal, the IEA 2024 World Outlook indicates that under its standard scenario model of demand (STEPS) the surge of renewable ( estimated to more than double X2 in the 5 year period to 2030) will first meet all new growth in demand for electricity and will then push coal fired generation into decline by more than 10% globally by 2030.
- The report indicates in 2023, there was a small but perhaps significant fall of coal demand by almost -2% which if continues would bear out the predictions in the above paragraph. This could mean reaching a point of ‘peak coal’ where total global demand stops expansion and begins a period of decline. The STEPs scenario has coal peaking in 2025 and declining gradually, led by developed countries and lower demand increases in developing countries.
- The report notes a key distinction between developed and developing countries, highlighted earlier, where in 2023 coal usage in the US and European power sectors fell by nearly a quarter. However overall coal demand in China and India largely offset that demand.
- However IEA revised its predictions upwards for total global coal from its 2023 WEO to the 2024 WEO by approximately 6% (300 million tonnes of coal). This is significant because it means that its estimates of the switch from coal to other cleaner sources is not happening as fast as initially predicted with major implications for climate policy. Nevertheless, even with this revision, the IEA in the 2024 WEO is confident that coal demand will decline by an average of -2% year on year through to 2050; a small but cumulatively significant trend, if it hold true.
3. Net Zero by 2050?
Following key points are derived from the International Energy Agency (IEA), Net Zero Roadmap – A Global Pathway to Keep the 1.5C Goal in Reach, 2023 Update (NZ50 Report)
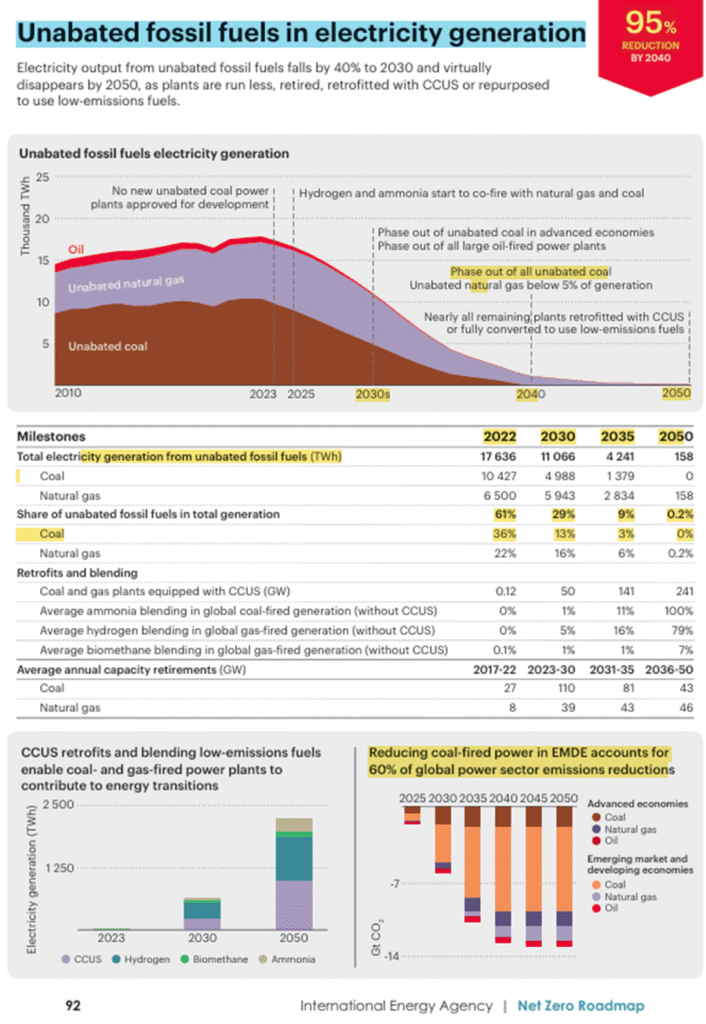
- NZE – The IEA Net Zero scenario (NZE) presented in the NZ50 Report provides a detailed pathway through what is possible (technically, financially and politically feasible) and what is required in terms of emission reductions in order to achieve Net Zero by 2050. As such it is a leading and vital roadmap for the potential achievement of this target and with it the prospects of keeping planet within 1.5 degrees Celsius of warming, considered to be a safe planetary boundary.
- The headline findings have rapidly gained widespread traction and are regularly quoted to compare current positions and progress. The report presents a number of key milestone diagrams which are at the core of the pathway design and the one above is one of the most vital related to fossil fuels. The stated near total elimination of fossil fuel emissions from electricity generation ( 95% reduction by 2040), combined with replacement by low emission electricity resources provides over 1/3 (34%) of the cumulative emission reductions required for Net Zero in 2050. The above table shows how this would be possible with particular focus for this Context Article on coal as highlighted in yellow.
- Coal is key The role of coal in this reduction is actually critical and particularly in developing countries – as shown in the lower right hand graph; a full –60% of the power sector reduction in emissions must come from the removal of coal power from developing countries (EMDE = Emerging and Developing Economies). So connected to the massive increase in coal burning particularly in developing countries percentage as presented in the earlier part of this Article, so the corresponding fall must be as steep and as fast to achieve the NZE outcomes required. And although not presented in the above table, that substitution must be to zero or near zero emission energy sources (renewables, carbon capture and nuclear) but not natural gas.
- Steep Decline Needed – And to achieve the reduction required, that reduction in coal consumption has to start early from now and fall fast. In fact coal share in total generation would need to halve in 6 years approximately from 61% in 2022 to 29% in 2030 before continuing a steep decline to effectively zero by 2050.
- CCUS assistance – This is not total elimination as the reference is to ‘unabated’ fossil fuels meaning that coal power plants that deploy carbon capture utilisation and storage technologies (CCUS) may continue, as illustrated in the lower left graph. However CCUS technology has continually failed to deliver on promises over the past 20 years due to the technically complex phases of CO2 capture, delivery and storage which has resulted in consistent reduction in the role envisaged by IEA for this technology including in the current WEO 2024 where it has admitted its falling ambitions for this technology.
Gap between NZ and reality:
- Pathway – It is important to note that the IEA’s Net Zero 20250 Report is not a prediction of outcomes in 2030 or 2050 (unlike its STEPS scenario counterpart) but rather presents a feasible albeit very ambitious pathway to achieve a defined outcome; ie. net zero emissions by 2050 (with remaining emissions balanced by CO2 removal).
- Current Policy – STEPS – Coal total capacity globally stood at 2,243GW in 2023 according to the WEO2024 report (Table A.3a, p299). The report also indicates that 26GW of coal power was retired in 2023, 88% of them in developed economies. Table A.3a also indicates that under existing policies (STEPS) that total coal should ease from 10,648TWh in 2023 to 9,213 TWh by 2030; a minimal reduction but followed by a larger reduction then to 6,969TWh by 2035.
- Additional requirements – NZE– Comparing the STEPS scenario figures with what is required for NZE and the size of the additional action to meet the NZE target becomes apparent. By 2030 coal electricity generation must fall under the NZE scenario to less than half the STEPs predicted position: from 9,213TWh to 4,988TWh and again fall again rapidly to 2035 down to 1,379GW which is represents a further reduction of nearly 4/5ths under NZE compared to the predicted position under the STEPs scenario. This illustrates both the scale of the reduction required as well as the challenge of coal generation involved.
- Significance – How will it do this in view of the attractiveness of coal which has led to such an expansion in its use for electricity generation in recent years, even when climate change and the impact of coal emissions has been widely known? Coal’s abundance, low price and promise of energy security for base load electricity demand has proven too attractive at least up to now to achieve that shift and yet the shift is vital to meet NZE goals. Without a major and sustained reduction in coal generation, the NZE goals fail and with it any prospect of remaining within 1.5 degrees of warming and possible 2 degrees as well.
- Challenge – This is a major challenge as the demand is principally in developing countries, and growing; who strongly argue that they need the same opportunities to develop as the developed countries did in the last century in large part on the back of coal power and who can or should try to stop them? It should and would not be possible. But is it possible that developing countries can essentially leapfrog over coal and other fossil fuel sources, with all their immediate economic strengths, and meet their growing demand from clean sources, renewables and nuclear? That question is a fundamental question for the future trajectory of carbon emissions and with it the fate in large part of global warming.
That is before we begin to consider the global knock-on impact that President Trump has in opposing the transition from fossils to renewables. This is the true transition challenge related to coal.
MCL – April 2025 (next update schedule: Spring 2027; more regular updates in the ‘Recent News Article Links ).
4. Recent News Links – COAL
Climate Junction – Update Posts
Recent News Links
- China to boost coal supply capability and enhance fuel’s role as baseline power | Reuters – Mar 2025