Context – Tipping-Points– Ice Sheets Melting-
Contents:
- Overview
- Mechanisms
- Impacts
- Reference Articles
- Recent News Articles
(Article Note – All references used in the Article are listed at the end of the article. Direct quotations are indicated in italics with emphasis highlighted in maroon.)
1. Overview
Triggering Thresholds– Temperatures and Timeframes (from McKay et al, Science (2022))
Type – Initial warming giving rise to feedbacks weakening system, leading to potential major tipping points where eventual collapse is guaranteed regardless of any carbon reductions after that point.
Triggering threshold temperature (estimated):
Greenland Ice Sheet collapse +1.5 degrees Celsius (range 0.8 – 3C)
West Antarctic Ice Sheet collapse +1.5 degrees Celsius (range: 1-3C)
Arctic Winter Sea Ice collapse- + 6.3 degrees Celsius (range: 4.5 – 8.7C)
– Abrupt Change Potential:
Greenland Ice Sheet collapse – Not Abrupt: (80% loss –1 to 8 millennia – high confidence)
West Antarctic Ice Sheet collapse – Abrupt (high confidence)
Arctic Winter Sea Ice collapse- Abrupt (high confidence)
– Reversibility:
Greenland Ice Sheet collapse – Irreversible – over millennia (high confidence)
West Antarctic Ice Sheet collapse – Irreversible – decades to millennia (high confidence)
Arctic Winter Sea Ice collapse- Reversible – within years to decades (high confidence)
– Impact Scales: – Global/Regional
Greenland Ice Sheet collapse – Global
West Antarctic Ice Sheet collapse – Global
Arctic Winter Sea Ice collapse- Global
The following key facts are derived from the IPCC’s 6th Assessment Report, Working Group 1 – Climate Change 2011: the Physical Science Basis (6thAR-WG1)
Arctic – Warming at more than x2 global rate and this trend will continue over 21st century, minimum temps increased by more than 3 times. Snow cover reductions across the Arctic and this will continue despite increase in winter snow. Arctic sea ice over at lowest since 1850 and will be ice free at least once before 2050.
Antarctic – Strong warming trend since 1950s, West Antarctica particularly expected to warm at greater rates than global. But net snow accumulation has also increased. Between 2-3C the West Antarctic Ice Sheet will be lost but over several millennia. From satellite data no significant trend appearing in loss or gain for Antarctic sea ice [update July 2025 – until recently when that has started to happen dramatically] .
2. Mechanisms
The accounts of the mechanisms are primarily taken from the Carbon Brief Explainer except where otherwise indicated.
Greenland Ice Sheet collapse
As indicated in Wikipedia, the Greenland Ice-Sheet (GIS) is the second largest body of ice in the world after Antarctic. The ice sheet is an average of 1.67km (1.0miles) thick and over 3km (1.9mi) at its deepest and covers 1,710,000 Km2 (660k sq mi), approximately 80% of the surface of Greenland.
The dynamics of GIS melt is driven by a number of specific positive reinforcing feedback loops with all, except the first, related to the albedo feedback effect where reduced ice cover reduces the amount of sunlight reflected back out to space and therefore increases further earth surface heating:
-First the elevation feedback which is considered the most important. As the surface of the sheet melts, the altitude reduces to lower and warmer altitudes leading to further warming.
-A second important dynamic is the snowline dynamic which is the elevation at which the icesheet is covered in show – as clean white snow has a higher albedo than darker muddied ice, when the snowline retreats in warming conditions, the albedo effect is diminished driving further melting.
-Thirdly is the trickle water feedback in which water from the melting snow and ice trickles through the ice-sheet and creates chasms in the ice which enables further melt.
Dr Ruth Mottram of Danish Meteorological Institute explains in Carbon Brief how this has “cascading consequences as the meltwater can affect ice sheet flow speeds and calving processes” which is where large portions of the ice sheet break off from the mainland to become floating icebergs. She also explains that about half of the melt rate occurs at the surface and the remainder through melting at the base via the breaking ( ‘calving’) off of parts of the ice sheet exposing the underbelly of the icesheet.
The Breakthrough organisation’s report on tipping points, Climate Dominos, highlights further significant feedbacks –increased high altitude rainfall where rain melts snow, again exposing the darker underneath ice sheet leading to further melting and algal blooms in the ice which darkens the ice colouring and again leading to higher heat absorption and melting.
Nevertheless, it should also be said that from the NAOO, 2024 was a good year for snow and ice. GIS lost mid-range 55Gt of mass in 2024 which was the lowest annual ice loss since 2013 due to above-average snowfall and below-average melting even with higher glacier flow rates.
West Antarctic Ice Sheet collapse
Wikipedia indicates that The West Antarctic Ice sheet (WAIS) is the smallest of three regions making up Antarctica; the others being the Antarctic Peninsula and the large East Antarctica divided by the Transantarctic Mountain Range. WAIS is more than 4km thick in places. Wikipedia provides some key statistics and processes for Antarctica: total volume of the Antarctic ice sheet is enormous at 26.92 million km3 while the WAIS contains 2.1M km3. Over the surface, ice is either rigid, held fast to ice ridges or it flows on ice streams lubricated by liquid water in the base sediments. Critically when the ice reaches the coast it creates large floating ice shelves affixed to the continent which constrain the flow of ice into the ocean for as long as they are present.
What is particularly significant about the WAIS as the IPCC indicates is that it sits on bedrock that is largely below sea level as illustrated in the diagram below where the blues and whites are below sea level by as much as 2.5km and is termed for this reason as a ‘marine based ice sheet’.
Carbon Brief Explainer describes how the ice shelves buttressing the land ice glaciers at the coast line are at risk of melting from warm air above and below from warmer waters. Thinning and collapse of these ice shelves cold trigger a rapid and irreversible flow of land ice to the ocean like in the nature of a stopper released from a horizonal bottle – referred to as ‘marine ice sheet instability (MISI).
As noted in a Scientific American article by R Alley, this has already happened spectacularly in 2002 when crevices opened in the glacier by ice-water melt caused the disintegration of the Larsen B Ice Shelf in a matter of weeks. It did not raise the sea levels as the shelf was already floating but increased ice flow by x6 to x8 times compared to previous flow rates but fortunately there was not a huge volume of ice stored behind the shelf. There is also the potential for massive Marine Ice Cliffs at the verge of the sheet to collapse under their own weight described as Marine Ice Cliff instability (MICI) though this process is less certain.
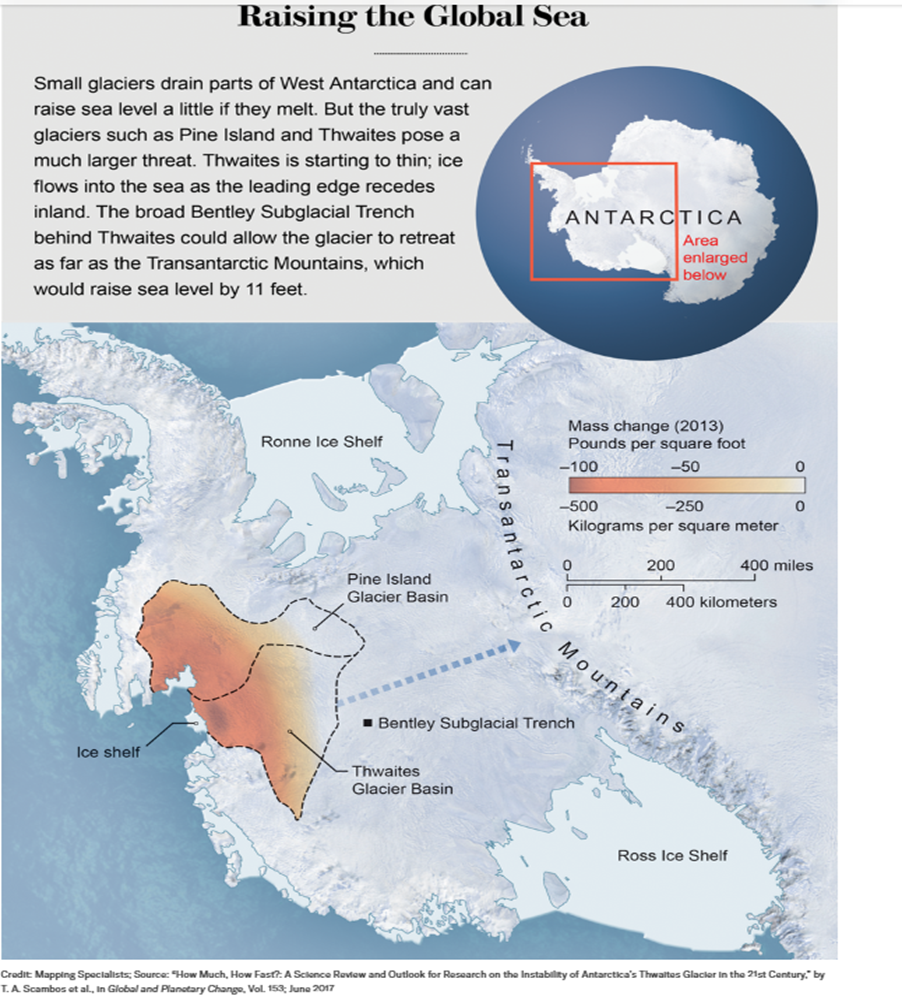
Of particular concern, because of their particular geological factors are two glaciers; Thwaites Glacier and Pine Island Glacier, which are more vulnerable to loss in the shorter term due to the ice grounding line and sloping ground back towards land. Following is a diagram of the region taken from R Alley’ article in Scientific American on Antarctica’s followed by a description and diagram of the likelihood of accelerated retreat of the glacier if the grounding point is ‘breached as a prime example of a MISI positive feedback loop’:
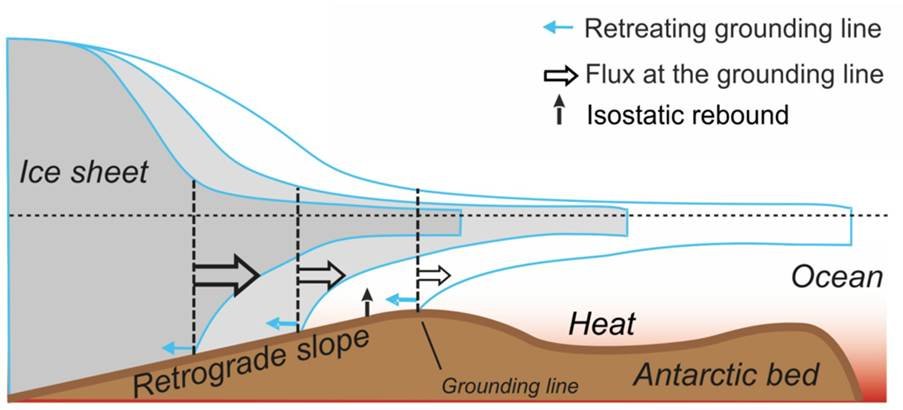
The illustration over shows how it works. As an ice shelf thins, more ice lifts off the seafloor and begins to float. This pushes back (see blue arrows) the “grounding line” – the transition point between grounded and floating ice (indicated by dashed lines). Floating ice flows more rapidly than grounded ice and so the rate of ice flow near the grounding line increases (black arrows). Faster flow means thinning, which may in turn cause more ice to lift off and float. And because greater thickness also causes the ice to flow faster, grounding-line retreat into deeper sections of the ice sheet can also produce faster flow.
What makes this a positive feedback loop is the retrograde slope of the WAIS’s bedrock. Not only is much of the bedrock beneath the ice sheet below sea level, large portions of it slope downwards away from the coast. This means that once ice sheet retreat reaches this point, it is self-sustaining.
Richard Alley in the Scientific American article talks about the passing of melt waters beyond the grounding line as ‘jumping the bump’ and ‘unzipping’ a pathway into the interior.
The Scientific American article also gives the example of the Bentley subglacial trench as a potential massive MICI event. This enormous trench more than 4000 metres (2.5 miles) in depth and filled with ice. Should the Thwaites glacier retreat as far back as this trench it would be met by this wall of ice, many thousand of meters high which could break fast which could simply topple and raise sea-levels fast as it is a land fixed shelf.
Overall the IPCC 6th AR characterises the evolution of the ice sheet as deeply uncertain stating: Deep uncertainty persists with respect to the possible evolution of the Antarctic Ice Sheet along high-end mass-loss storylines within the 21st century and beyond, primarily related to the abrupt and widespread onset of marine ice sheet instability and marine ice cliff instability. (See also Boxes TS.3 and TS.4).
3. Impacts
Greenland Ice-Sheet collapse
The NAOO indicates that the Greenland Ice Sheet (GIS) holds the equivalent ice to raise global sea levels by 7.4 meters.
The IPCC 6thAR-WG1 indicates ‘Over the period 1992–2020, Greenland likely lost 4890 ± 460 Gt of ice, contributing 13.5 ± 1.3 mm to GMSL rise. There is high confidence that Greenland ice mass losses are increasingly dominated by surface melting and runoff, with large interannual variability arising from changes in surface mass balance.’ (TS2.5)
It states that the melt is unlikely to be abrupt and will on medium climate heating pathways still continue over 1000s of years; losing up to 25% in low warming, to 57% in medium warming and up to 100% in high warming but over a duration of a thousand years.
While the melt rate is slow and not abrupt, it is also irreversible in the sense that what has melted will not be recovered before the next ice age even if temperatures are stabilised. As Dr Mottram is quoted as saying “ if there was no ice sheet in Greenland under today’s climate it would not be able to built it up again. So once its gone its gone until at least the next glacial period”.
It is considered that the self-reinforcing feedbacks means that at current temperatures, the Greenland Ice-sheet will continue to melt which means it has already reached a tipping point threshold beyond which its eventual collapse is irreversible. While some discussion has been had in academic papers about the actual temperature threshold for this tipping point, but all relatively low in the range of 1.1 up to 2.3C; others consider a negative surface mass balance (SMB) to be the key factor. SMB accounts for all snowfall and snow and ice loss in a year to determine if the net contribution is positive or negative. Carbon Brief reports that sometime in the period from 1970s to 1980s the SMB switched negative to overall losses and as NOAA indicates has continued negative every year since.
However concerns exist regarding the ability of computer models to correctly capture the processes and speeds at which the GIS is dis-integrating. The Breakthrough report reports Jason Box, Professor of the Geological Survey of Denmark and Greenland that
“several physical processes and amplifiers guarantee more rapid response of the ice than currently encoded in climate models that project sea-level rise… we cannot rely on ice sheets models for credible sea level projections”.
Nevertheless in its view the GIS loss is driven primarily from above than from warmer ocean temperatures as in the case of the West Antarctic Ice Sheet and is for that reason a much slower process.
West Antarctic Ice-Sheet collapse
Carbon Brief indicates that the Antarctica’s contribution to total sea level rise comes mainly from the WAIS region centred around the Amundsen sea sector glaciers. Pine Island and Thwaites are it states thinning at rates of 49 and 45cm per year each respectively. Thwaitesglacier.org indicates that currently this glacier is contributing 4% of global sea-level per year. It indicates that if the Thwaites glacier collapses this alone would add 65cm of sea-level rise, which is almost equivalent to the total sea-level rise estimated by IPCC for this century. Richard Alley in the Scientific American considers this could be more than approximately 3 times higher at 3.35 Meters if the melting reached back to the Bentley trench.
The major question with global significance is whether on and under the Thwaites Glacier a MISI tipping point for irreversible loss has already commenced on this glacier? And if so, how fast it might take to fully collapse and melt away?
Overall the IPCC 6thAR-WG1is non committal and characterises the evolution of the WAIS ice sheet as deeply uncertain stating: Deep uncertainty persists with respect to the possible evolution of the Antarctic Ice Sheet along high-end mass-loss storylines within the 21st century and beyond, primarily related to the abrupt and widespread onset of marine ice sheet instability and marine ice cliff instability. (See also Boxes TS.3 and TS.4).
However a number of facts quoted by Thwaitesglacier.org are concerning: the amount of ice loss by Thwaites and neighbouring glaciers has doubled in the past 30 years, that Thwaites Glacier is undergoing the largest changes of any ice-ocean system in Antarctica, and simply the scientific confirmation that warming of the atmosphere and ocean and their interaction with the glacier are driving the rate of melting change.
In September 2022, Nature Geoscience published an article by Alastair Graham et al which indicated that over a period of 5 months observations Thwaites Glacier retreated at a rate of greater than 2.1km per year which was twice the rate as the eight year period up to 2019 and conclude that pulses of rapid retreat have occurred at the glacier in the past and are ‘likely to occur in the near future when the grounding zone migrates back off stabilising hight points on the sea floor’.
Carbon Brief notes from a NATURE Climate change review paper published in 2018 that ‘a key threshold for survival of Antarctic ice shelves and thus the stability of the ice sheet seems to lie between 1.5 and 2 degrees C mean annual air temperature above present’. In a critical clarification Carbon Brief indicates that this is a reference to the regional temperature increase not the global temperature increase and because the poles are warming more rapidly that timeframe is essentially the same as +2C globally since pre-industrial times.
Finally, the Breakthough Reports highlights the connection of the Thwaites glacier to the neighbouring glaciers which flow into the same basin and indicates that ‘the demise of the Thwaites could eventually lead to the loss of all of WAIS resulting in 3 meters of sea level rise and putting at risk the lives and livelihood so 250 million people’ Notably, this figure of 3 metres is approximately the same figure referenced by Richard Alley in his article.
Sea level rise – example of the Mekong Delta
This Context article has looked at the potential for the melting of the Greenland Ice-sheets and the West Antarctica Ice sheets particularly the Thwaites Glacier. The melting of these ice-sheets is considered in terms of the resulting seal level rises which is considered to be up to several meters in each case, although the timeframes are uncertain.
But even the impact of sea level rise of 1 meter is significant, which is the predicted rise by the end of this century by the IPCC’s 6thAR-WG1 if there is no major change in emissions. This is well illustrated in the book by Lawrence M Kraus, The Physics of Climate Change where he looks at the Mekong river delta in Vietnam.
Reflecting on the beauty of the river and its delta, he describes how a daily battle of the water forces exists where the drive to the sea of the river waters are stalled by the incoming tides but however into which little salty sea water actually penetrates. Sadly, this is a battle he indicates because of rising sea-levels that will be lost by the river and indeed the whole delta.
The delta topography was indicated from satellite readings between 2.3 and 3.6 meters above sea-level. However this was recently revised to only 1 meter above sea-level due to a corrected calibration of marker reference points to provide the readings. The delta which has a sedimentary base is also sinking at a rate of centimeters each year and by the end of the century is calculated to drop by half a meter. With a half meter of sea level rise predicted by the IPCC 6AR-WG1 report, as a minimum and likely much more up to a meter, it means that three quarters of the delta will be exposed to flooding well before the turn of the century, especially from sea surges and salination rendering the land infertile or drastically reducing fertility.
As Kraus explains with this limited almost guaranteed sea level rise, most of South Vietnam which lies within the Mekong Delta will be below seal level. This is an are in which currently 12.3 million people live and with its rich alluvial soils is a major source of food for a much larger population throughout the region through freshwater fishing and rice production.
And of course the Mekong delta is not alone with predicted sea levels which will certainly flood major coastal cities such as Dhaka in Bangladesh, Mumbai and Kolkata in India, Guangzhou and Shanghai in China, Ho Chi Minh City, Vietnam, Jakarta, Indonesia, Lahore in Pakistan; in Africa, Lagos, Abidjan and Alexandria in the US Miami, New Orleans and New York which are considered to be at particular risk. Sea level rises of this magnitude places at significant danger hundreds of millions of people living in and around these cities and many more being displaced from their homes with the dire knock-on consequences for loss of livelihood, hunger, disease and mass migration.
As Kraus concludes:
The question of how these countries and their cultures might survive through to the other side will reflect, in microcosm, how humanity in general will deal with a global phenomenon that is unprecedented in modern human history and about which we have had fair warning. (p162)
Depending how we collectively can respond, that last comment about fair warning may be the most damning of all.
4. Reference News Articles
- Carbon Brief – Explainer: Nine ‘tipping points’ that could be triggered by climate change – Carbon Brief
- Climatetippingpoints.info Arctic Sea Ice and Positive Feedback Loops – climatetippingpoints.info
- What does the new IPCC report say about climate tipping points and feedbacks? – climatetippingpoints.info
- BreakThrough -Climate Dominos report- Climate Dominoes | Breakthrough
- IPCC –
- Regional_Fact_Sheet_Polar_regions
- IPCC AR6 Working Group 1: Technical Summary | Climate Change 2021: The Physical Science Basis
- Lawrence M Krauss The Physics of Climate Change , published 2021 by Head of Zeus publications, UK.
- NOAA (National Oceanic and Atmospheric Administration).gov – Arctic Report Card 2024 – Arctic Terrestrial Carbon Cycling – NOAA Arctic
- Scientific American – R B Alley 2019 – Are Antarctica’s Glaciers Collapsing? | Scientific American
- International Thwaites Glacier Collaboration – ITGC Thwaites Glacier
- Wikipedia –
- Greenland ice sheet – Wikipedia
- West Antarctic Ice Sheet – Wikipedia
5. Recent Posts and News Articles
Climate Junction
Recent News Links
Greenland
- Cracks in Greenland Ice Sheet grow more rapidly in response to climate change, study warns – Feb 2025
- Greenland losing 30m tonnes of ice an hour, study reveals | Ice | The Guardian –- Jan 2024 ‘20% more than was previously thought.’
Antarctica
“Ice sheets are very sensitive to melting in their grounding zones. We find that grounding zone melting displays a ‘tipping point like’ behavior, where a very small change in ocean temperature can cause a very big increase in grounding zone melting, which would lead to a very big change in flow of the ice above it,” – working to put into models now