Context – Science- Paleo Climates – Warnings from the Earth’s Past
Content
- Introduction –
- Key Comparators – Paleo-Climate Reference Periods
- Another World is Possible (…but just not how we would want it) –
- Source Reference List
(Article Note – All references used in the Article are listed at the end of the article. Direct quotations are indicated in italics with emphasis highlighted in maroon.)
1. Introduction –
One of the remarkable abilities of recent climate science has been its ability to reconstruct past climates from a range of sources called proxies whose characteristics allow us to determine climatic conditions from well before instrumentation made direct evidence possible, before indeed before humans existed, extending back hundreds of thousands of years and in fact back tens of millions of years ago.
As Wikipedia outlines, these proxies include air trapped in polar ice cores to depts of kilometres providing valuable atmospheric composition evidence reaching back in time to more than 100k years ago(k = 1000); sea-bed and land sedimentary layering which preserves biotic life forms back to millions of years ago from which carbon and oxygen isotopic analysis can infer climatic conditions and zones as well atmospheric conditions, sea-levels and temperatures from the period studied.
As the IPCC’s 6th Assessment Physical Science -Working Group1 Report 2021 Technical Summary (6AR – TS) indicates (Box TS.2, p45): better proxy records and chronologies have enabled greater alignment between climate modelling of conditions and reconstructions from proxies giving us a better understanding of Earth’s deep past or ‘paleo climatic conditions’ and responses to ‘eternal forcings including from Earth orbital [ Milankovich cycles] and plate movements, solar irradiance, volcanic activity, ice sheet size, and atmospheric greenhouse gases’. The 6AR-TS also tells us this paleo-climate data gives us important information on equilibrium climate sensitivity (‘ECS’ – the steady state temperature response to a doubling of atmospheric CO2 – see also the Context Article – Greenhouse Gases)
A key finding of these paleo-reconstructions back into the millions of years show a clear and strong alignment between CO2 levels and temperature fluctuation. These various CO2 markers provide key comparators or analogues for climatic conditions compared to the CO2 levels today and indicators of how the climate might behave in the future, based on this paleo-evidence and future CO2 levels.
The following table from 6AR-TS provides, at high level and in condensed format, a listing of key reference paleoclimates, their CO2 levels, corresponding temperatures and sea levels compared to baseline 1850 (pre-modern times) levels:
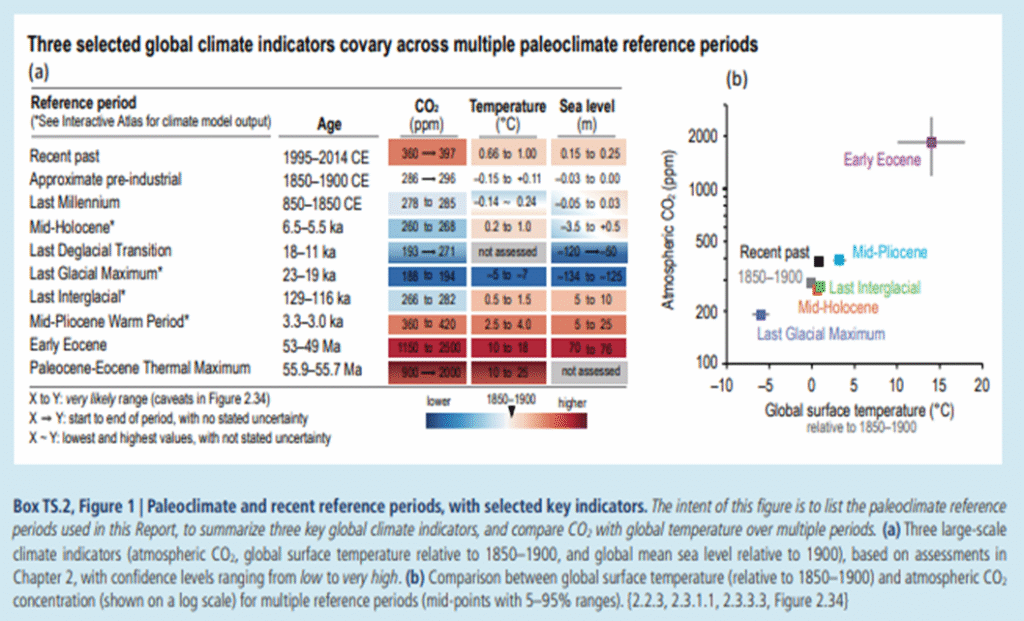
This article will look in further detail at 3 of these paleoclimate reference periods to see what the comparative conditions were like and what lessons we can draw from them:
- the Last Interglacial 129-116,000 years ago (ka), also referred to in the literature as the ‘Eemian’ period
- the Mid-Pliocene warm period, 3.3-3 million years ago (Ma) [note the Ka in the table above is a mistake in the report] and
- the Paleocene-Eocene Thermal Maximum (PETM) – 55.9 to 55.7 million years ago
However before going into these further below, it is useful to note from the above diagram how climate sensitivity to emissions has changed through time: in the graph alongside – ‘(b)’: the Last Interglacial had similar temperatures as in the recent times but with lower CO2 levels while the Mid Pliocene had very similar CO2 levels but several degrees higher temperatures. We will look at some of the significance of these in the next section.
It is also important to look in this context at how current carbon emissions compare to the geological record going back 60 million years. It can be seen from this table that CO2 is indeed as often indicated higher now than at any time over the last 800,000 years right though the glacial/interglacial ( alternating ice age and warm periods) appearing as the tooth shaped duration below in the graph above. What is noteworthy is that, depending on the world’s particular emission carbon emissions pathways- indicated below as SSPs under the IPCC scenario models, the highest emission pathway model (SSP5-8.5) could reach carbon and temperature increases not occurring for 40 Million years, approaching the levels of the PETM one of the periods discussed in the next section.
2. Key Comparators – Paleo-Climate Reference Periods –
(Information derived in this section from IPCC and Wikipedia, references are listed at the end of the article)
i. The Last Interglacial (Eemian) Period – 130-115kya
The Last Interglacial Period lasted about 15 thousand years from 130,000 to 115,000 years ago and ended at the start of the Last Glacial Period and corresponds with the first modern humans. As briefly noted above, CO2 levels was significantly lower than today at 280 ppm, indeed comparable to pre-industrial times. However the temperature was one of the warmest in the past 800,000 years with temperatures between 0.5 to 1.5C degrees warmer than present and generally wetter conditions than current. It must be immediately stated that likely cause of the warmer conditions relates to earth orbital patters (Milankovitch cycles) and not CO2 forcing However the real significance of this period for modern times is not the temperature rise but that with the small increase in temperatures relative to today, sea levels were between 5 and 10 meters higher than present. If that were repeated today, vast tracts of the earth surface would be under water including most coastal cities up to several kilometres inland.
Although much of the Greenland Ice sheet remained glaciated, melting in that region contributed approximately 2 meters to the total sea level rise (SLR). Recent studies based on marine sediments reported in Wikipedia indicates that the West Antarctic Ice Sheet had melted and added up to 2.5 meters rise per century, an unprecedented speed of SLR. Forests extended high into the Arctic Circle and hippopotamus and other warmer climate animals extended their range as far as Yorkshire in England.
What is also notable is that with the melting in the Arctic region and the Laurentide Ice Sheet, the fresh water outpouring caused the Atlantic Meridional Overturning Current (‘AMOC’ ) see Context article) to either fully off position or weakened significantly ,resulting in much cooler conditions in Southern Europe particularly. The weakened AMOC had broader global impacts, substantially weakening the Indian Monsoon.
The relevance of the Last Glacial Period to today relates to the vulnerability of the Arctic and Antarctic Ice Sheets to moderate warming and the major impacts in terms of rapid and large sea level rises, the slowing/stopping of the AMOC as well as a feedback effect on the Indian Monsoon which is critical water supply for agricultural and drinking water in the Indian sub-continent.
II. Mid Pliocene Warm Period (MPWP)– 3.3-3.0 Mya
This warm period lasted three hundred thousand years from 3.3 million years ago to the start of a new glacial period approximately 3Mya. The global geography and intensity of the sunlight were similar to current conditions making it a good analogue for today’s conditions. The AR6-WG1 main report (p367) indicates the data for the period is indicated with a high degree of confidence.
Atmospheric CO2, determined from Carbon 13 to Carbon 12 isotopes and stomatal density of fossilised leaves, is estimated around 400ppm which is again very similar to current day levels. Indeed, we have to go back this far to find a period with CO2 levels similar to present day volumes. However the average temperatures in the period as indicated in the AR6-TS table is between 2.5 and 4 degrees warmer than today, although the climate cycled through shorter glacial interludes in the period with large variances in the Greenland Ice sheet. Again temperate climate trees, particularly hollies and beech trees as reported in the AR6 -WG1 were dominant in the Arctic in the period. Mark Lynas reports in his book ‘Our Final Warning’ describes how a 4 million year fossilised remains of a beaver colony was discovered in the Arctic Circle, with primitive rabbit, shrew and horse bones also in the vicinity, this is more than 2,000 km north of their habitat today!
The ‘polar amplification’ effect (where the poles experience faster and more warming relative to rest of the planet) also existed where temperatures were on average 8 degrees higher as measured in Eastern Alaska meaning the Arctic was close to 0 degrees compared to an average of -6.4C today.
But as in the Last Interglacial Period, as seen earlier, the most notable feature of the period for present purposes was the much higher sea levels indicated as varying between 5 and 25 meters higher than present before the onset again of a longer glacial period 3 million years ago. The high sea levels related to the warmer polar conditions causing widespread icesheet instability. The West Antarctic Ice Sheet did not exist and much of the Greenland Ice Sheet had melted. Sea level of this scale would reduce the continental mass by several thousands of square kilometers, sinking many costal metropolises several meters under water.
Again the significance of the period is the loss of ice cover in the polar regions at CO2 levels similar to those of today raising a question mark over the degree of committed warming and stability of the ice caps and resultant sea level rises.
III. Paleocene-Eocene Thermal Maximum (PETM) – 55.9-55.7 Mya
The Paleocene-EoceneThermal Maxium is the earliest period and the most dramatic reference period in terms of the climatic extremes experienced, lasting about 300,000 years, from 55.9 to 55.7 million years ago . The significance of this period for climatic comparison purposes is the major climatic feedbacks which drove the average global temperatures in period to rise between 10 to 25 degrees Celsius higher than present. The IPCC AR6 WG1 report indicates (5.1.2.1) that CO2 concentrations increased from about 900PPM to around 2000 PPM in a period between 3 and 20 thousand years. This levels of Carbon emissions to the atmosphere were enormous – according to Frieling et al article in the PNAS academic journal article (listed below); 1500 peta grams of carbon was emitted over a 60kya period; to break that figure down: [1 petagram = 10 Giga (billion) tonnes of Carbon = 3.67x10Gt CO2 = 36Gt of CO2 x 1500!], so the total CO2 emitted in the period was 54,000Gt CO2 were released over a period of over 50,000 years, a volume of emissions not ever since seen to date.
Carbon 13 isotopic ratios -there has been much academic debate on the timing and sources of the carbon emissions. The emissions source are traced through evidence of the depletion of the carbon isotope, Carbon-13 relative to the standard Carbon-12 atom. The standard Carbon-12 atom is absorbed preferentially in photosynthesis which is buried in ocean and sediment resulting in a relative increase in the volume of Carbon-13 in the normal course. However when this stored organic carbon is released to the atmosphere, the Carbon-13 ratio in the atmosphere correspondingly decreases as the locked Carbon-12 is released to the atmosphere. It is this fingerprint of massive Carbon-13 relative depletion (termed ‘carbon isotope excursion or CIE) which indicates an initial rapid release from sedimentary rock of the organic carbon-12 into the atmosphere over a geological short period of a few thousand years. There then followed a stable period as Frieling et al. explain where the CO2 levels remained at very high levels for 70-100,000 years before a decline (recovery) over a further 50-70,000 year period.
Causes – Several mechanisms as Frieling explains have been proposed to explain the massive extrusion of the organic Carbon-12 CIE including enhanced volcanism, organic matter oxidation from permafrost thawing to disassociation of methane (CH4) gas hydrates at the bottom of the seas. However it is now considered following Freiling et al’s investigation that there were two phases; first the warming of the upper levels of the oceans from heightened volcanic activity west of Shetland, thought from hot magma which warmed the oceans. This warming reached down into the intermediate depths which activated and released the Carbon 12 rich sediment in the form of seafloor methane hydrates.
In effect, the heating of the waters provided an enormous feedback effect in the form of methane hydrates release; and as noted in the Greenhouse Gases Context article, methane is 86 times more powerful warming effect than carbon dioxide. Frehling indicates that there were 4 to 12 pulses of carbon released as the methane heated the atmosphere and the seas warmed further creating self perpetuating cycles or pulses of further methane discharges from the ocean floor as the waters heated further. The Friehling article concludes ‘CH4 (methane) from the Norwegian Sea vent complexes was likely the main source of carbon during the PETM following its dramatic onset’.
The consequences for the climate was drastic and catastrophic for life on the planet in the ocean and on land as well as geological effects which will be discussed in the next section.
Relevance – However the event has relevance for today and is stated by Philip Gingerich in his 2019 article in Paeoceanography and Paleoclimatology, as ‘ a benchmark global greenhouse warming event which helps us to appreciate the rates, process and risk of present day carbon release to the Earths atmosphere and ocean’s and the conclusions, repeated in IPCC 6AR-WG1 report are both startling and deeply worrying. The article scales the volume of carbon release during the initial rapid onset stages of the PETM and corresponding warming with current volumes of carbon being discharged to the atmosphere in the present time (but due in our case to fossil fuel burning) in which the volumes and timescales are well understood. It concludes:
‘modern rate are some 9-10 times higher than during the onset of the PETM. If the present trend of anthropogenic emissions continues, we can expect to reast a PETM-scale accumulation of atmospheric carbon in as few as 140 to 259 years (about 5 to 10 human generation).’
3. Another World is Possible (… Just not how we would want it)
Mark Lynas in his excellent text account of the impacts of heating by degrees on the earths climate and natural systems: Our Final Warning – Six Degrees of Climate Emergency, spends some time describing what the PETM world would have looked like from the evidence (geological, sedimentary gas and pollen records).
PETM was a ‘hyper thermal’ sudden and extreme greenhouse gas event when CO2 reached between 1000-2000ppm and temperatures rose rapidly over a period of 4000 years (a short span in geological timeframes) to summertime land averages of 25-28degrees. The Arctic had the equivalent animals of the tropics with alligators, rhinoceros and hippo predecessors, mangroves, palm trees and relative of the African baobab and the ocean also similar temperatures meaning no ice coverage.
Dead Seas – But while the poles might have resembled some kind of early Eden, the rest of the planet fried, wilted and died. The oceans off the coast of current Nigeria had temperatures of 37 degrees, 2 degrees hotter than the limit of tolerance of ocean living organisms and plankton disappeared from the sedimentary records in the region. The waters became so acidic (decrease in pH of 0.15 -0.3) that not only could calcifying organisms not develop but the shells of sedimentary fossils dissolved . Oceans in rising temperatures though the planet become anoxic (de-oxygenated) contributing to the mass die off of all higher organisms and bacterial release of poisonous hydrogen dioxide and harmful algal blooms spread in the warmer waters which produced neurotoxins making most of the ocean waters unhabitable. In short the marine food chain completely collapsed wiping out multicellular organisms from most of the Earths seas. It is notable that we are observing significant increase in anoxic conditions in the ocean waters, algal blooms and perhaps most troubling, as Lynas indicates, pH is expected to fall 0.4 by end of this century.
Scorched Land, the climate in the period was a mix of scorching aridity interspersed with massive rain storm events – plant life dying in the parched earth, the soil dried to dust and the storms sweeping vast volumes away in flash flooding events over the surface of the whole planet; geological markers described from a number of locations in Spain and other locations with enormous dust storms and generally climate and land, conditions that remained hostile to all forms of higher land life and for tens of thousands of years which had previously been flourishing. As Lynas indicates: ‘All these regions suggest that the land surface was devastated and denuded by a deadly sequence of desertification and extreme floods. One can only imagine the intensity of the heatwaves that accompanied them.’
Analogies – The PETM is a good analogy for the power and consequence of climate tipping points discussed in the tipping points Context Series of articles. As noted earlier, there are a number of identified possibilities but likely in the dynamic was a cascading series of events starting from volcanic activity raising carbon and land and sea temperatures which caused the thawing and release of permafrost on land, causing further heating which warmed the seas sufficiently to cause the shallow water methane hydrates to dissolve and release the methane to the atmosphere, quickly causing the massive spiking in carbon volumes and temperatures and a upward repeat of the cycle of planetary heating. It is a geological example and lesson in the reality of this additional danger created by the direct fossil fuel burning activities of humans.
However as Lynas says, the PETM is not a good analogy for today’s conditions, not because it is too extreme but because it is not extreme enough! Although larger amounts of carbon were released over the entire 170,000 year evolution of PETM the event (we would have to burn all fossil fuel reserves to come close) but the rate of carbon release today is orders of magnitude larger than anything that occurred even at the height of the PETM.
As to the significance, Lynas quotes the 2017 Science article by Daniel Rothman, Thresholds of catastrophe in the Earth’s system which asks why in the past 542 million years there were only 5 mass extinction events related to disturbance of the earth’s carbon cycle when in fact there were many more such perturbations in the period. After reviewing the evidence the answer Rothman provides is that:
‘perturbations of Earth’s carbon cycle lead to mass extinction if they exceed either a critical rate at long time scales or a critical size at short time scales’.
‘As Lynas notes, in todays world we are on course to doing both by releasing the vast store of carbon, laid down over eons, in a few short decades through our burning of fossil fuels. It is possibly the most salutary lesson from the paleo climatology that there is, though with close company from the more recent Pliocene and Last Glacials to provide further illustration of the connection between carbon and climate.
4. Reference List
- IPCC AR6 Working Group 1: Technical Summary | Climate Change 2021: The Physical Science Basis
- IPCC_AR6_WGI_FullReport.pdf
- Last Interglacial – Wikipedia
- Mid-Piacenzian Warm Period – Wikipedia
- Paleocene–Eocene Thermal Maximum – Wikipedia
- Frieling-et-al-2016-thermogenic-methane-release-as-a-cause-.pdf
- Paleoceanography and Paleoclimatology – 2019 – Gingerich – Temporal Scaling of Carbon Emission and Accumulation Rates Modern.pdf
- Mark Lynas ‘Our Final Warning – Six Degrees of Climate Emergency, 2020, Harper Collins
MCL – March 2025
(next update schedule: Spring 2028; more regular updates in the ‘Latest News Section’).