Context – Sectors- Industry –
Contents
- Emissions and Energy Profile
- Reducing Process Emissions
- Future Demand and Net Zero Targets
- Emission Reductions – Potentials and Challenges
- References
- Recent Update Posts and News Links
(Article Note – Direct quotations are indicated in italics with emphasis highlighted in green. All references used in the Article are listed at the end.)
1.Emissions and Energy Profile
Industry Emissions–
Assessing energy use and emissions in Industry is not a straightforward task because of ‘boundary’ issues as much of the products can be allocated to the seperate building sector, particularly from heavy industry such as cement and steel embodied in buildings or can also be counted in the ‘energy’ sector as industry is a big user of electricity. In this article, emissions are attributed to the supplier/ primary producer/, ie. the industry sector such as cement, steel rather than the final use such as in buildings or the energy source such as electricity or direct coal or gas.
Cement, Steel and ‘other’ industries
The IEA Energy Series indicates that in 2022 the industry sector was directly responsible for 9 Gigatonnes (Gt) of CO2 (Gigatonnes= billion tonnes ).
Of this 9Gt CO2 it is estimated that:cement production released 2.6Gt CO2, (7.5% global emissions), steel production released 2.8Gt CO2 (8% global emissions), all other industry contributing the remaining 3.6Gt CO2 (10.3% global emissions), (figures provided from Zenodo for cement and IEA for steel).
For 2023 cement production fell slightly to 2.36Gt CO2 but steel production jumped almost one third to 3.6Gt CO2 which is likely due to a rebound effect after Covid19.
CO2 emissions have soared in industry by about 70% since 2000 according to IEA Energy Series as a result of ever increasing global demand for manufactured goods and consumes approximately 37% (166EJ) of global energy usage. Production rebounded after Covid but there are signs that the production are levelling off, particularly in China, however this is counter balanced by a growing demand in other developing countries are likely to continue with a resulting gradual net increase in production and related emissions.
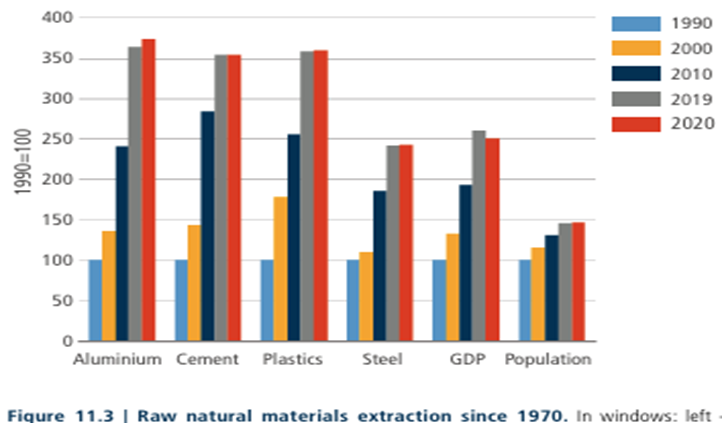
Following chart from IPCC in its IPCC’s 6th Assessment Report, Working Group 1 – Climate Change 2021: the Physical Science Basis (6thAR-WG1)
in Chapter 11 (Industry) illustrates the growth of production of key industrial materials compared to GDP and population growth:
Production Processes Cement and Steel
Cement – Cement production is divided into a number of processes; firstly raw materials of limestone, clay and other materials are crushed into a fine power called raw meal. This raw meal is then heated to very high temperatures of 1450 Centigrade which causes a chemical reaction (‘calcination’) producing hard lime pellets called ‘clinker’ and large quantities of CO2. The clinker is then mixed with gypsum to create the finished cement powder which is then bagged. Approximately 60% of the CO2 emitted is caused directly through the calcination process to produce the clinker and the remaining 40% is the result of the burning of fossil fuels, mainly coal but also gas, to reach the high temperatures for the process to work.
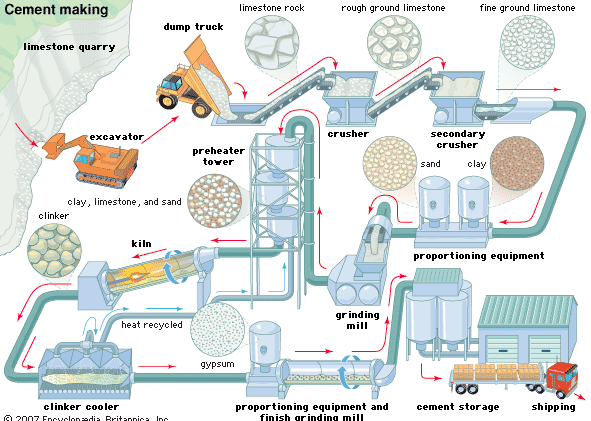
From: Cement – Strength, Admixtures, Hydration | Britannica
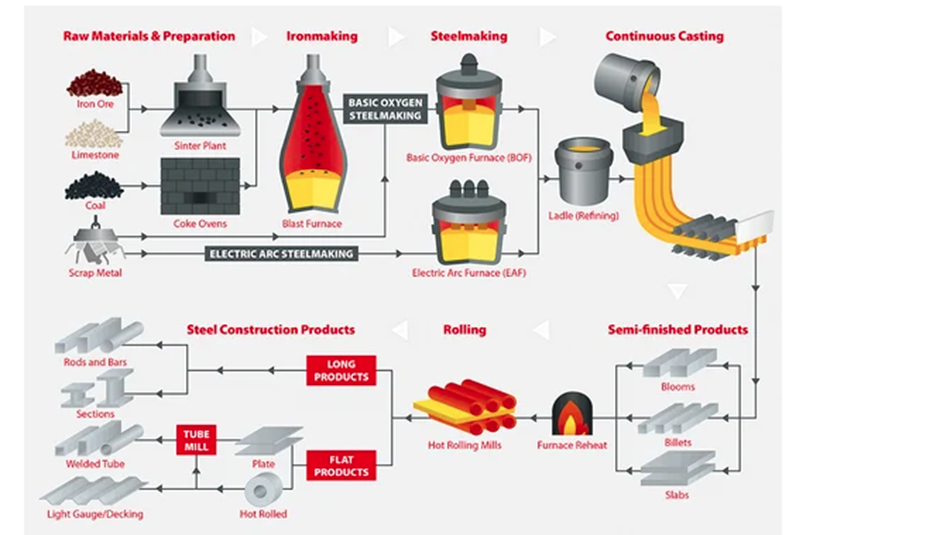
Steel – There are two distinct processes for producing steel; the first is the raw process in which steel is first produced Blast Furnace-Basic Oxygen Furnace (BF-BOF) which produces approximately 70% of world steel. Iron ore is melted at extremely high temperatures of 1600 degrees Centigrade using coke (refined coal), limestone and hot air to produce molten iron called pig iron. The molten pig iron is then transferred to the basic oxygen furnace where it is refined by bubbling oxygen through which removes impurities and the carbon content producing molten steel which can be cast into many shapes or solidified into ingots. A large amount of CO2 is also produced at the molten pig iron stage of production so, like cement production, CO2 is both the direct waste product of the manufacturing process as well as from the burning of the fossil fuel to reach the heat required for transformation.
2. Reducing Process Emissions
Steel and Cement production emissions are considered ‘hard to abate’ due to the very high heat that is required. 75% of the energy required for these and other similar energy intensive industries (eg aluminium production) exceeds 400 degrees centigrade which means that electricity cannot currently provide the heat required in their production. To reduce emissions, material efficiency can go some way toward reducing demand for cement and steel such as more recycling in the case of steel and reducing the clinker content in the production of cement.
Material Demand Management – IPCC in its 6AR, Chapter 11 (Industry) indicates that cement is overused because it is inexpensive, durable and readily available but does not reflect the environmental cost of its production in terms of CO2 emissions in its production or indeed other industrial processes.
This would only be reflected where a carbon price, either in the form of a carbon tax or cap and trade system, correctly added this cost to production at a global level. Key to efficiency of use would be changing architectural and engineering practices to reduce the amounts of steel and cement used perhaps driven by regulatory controls such as building codes and other forms of control. Extending the life of buildings through refurbishment as well as better product design to reduce steel or other heavy emission materials in the product would all help to reduce overall production and related emissions incentivised by carbon pricing fixed at sufficient cost to incentivise these changes.
Low Emissions Fuel – the other main area of potential emissions reduction relates to the utilisation of either other forms of fuel sources than fossil fuels which for coal or steel is principally the use of hydrogen. Alternately the installation of carbon capture, utilisation and storage (CCUS) at cement, steel and other heavy industry plants to capture the CO2 before it is released into the atmosphere and then pumped transportation of the CO2 and either further industrial usage and/or underground storage in secure geological storage locations (also referred to as CCS where no utilisation is involved).
CCUS Cost Margins – However, as an additional process, CCUS is a further significant cost estimated by SINTEF for cement production as adding in the range of 50-90% extra to the total process cost which is large but avoiding 90% of the CO2 emissions while for steel the cost increase is smaller at 20% cost increase and avoiding 60% of emissions.
SINTEF makes the point that these costs need to be considered in the context of the value of the final product or building which would of course then be a much smaller cost of the final erection, citing the example of a building with a 10% overall cost increase for a corresponding reduction of 50% of its construction related emissions. But whether cost surveyors consider it in the same manner is uncertain when margins are tight and competition is fierce.
Hydrogen production –
Hydrogen could play a critical part in the decarbonization of steel and cement production. For steel, hydrogen could substitute for coke to produce the pig iorn in the direct reduced iron process and in cement production, hydrogen could be used to provide the fuel for kiln furnaces. In each case substituting heavy emitting coal or gas and reducing CO2 in the process.
However it matters significantly how the hydrogen is produced. Grey hydrogen is produced through steam methane reforming (SMR) using natural gas which is the most common process currently but releases a large volume of CO2 into the atmosphere so is not a low carbon option and adds little or may even have a large carbon footprint than using fossil (natural) gas. Blue hydrogen is also produced using SMR but would include CCUS technology, the addition of CCUS makes it substantially more expensive than grey gas. Finally ‘green hydrogen’ which utilises electricity to water into hydrogen and oxygen by-product through electrolysis. It is a very clean form of hydrogen production provided that the electricity utilised is renewable sources. It is currently expensive because of the amount and cost of electricity required and the cost of electrolysis technology.
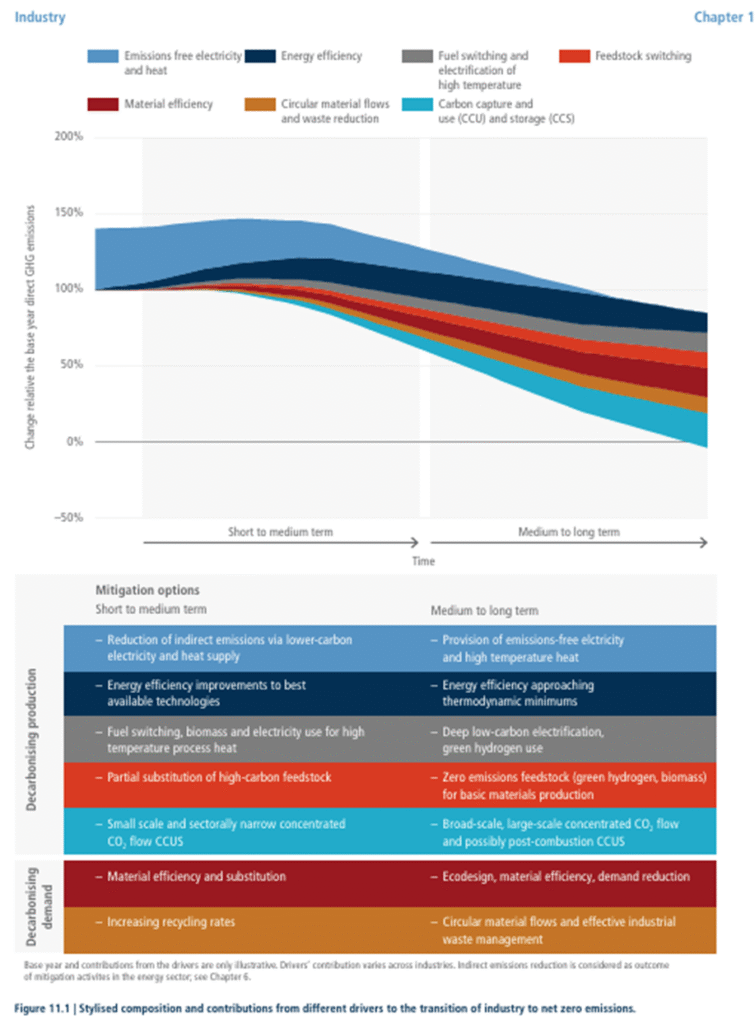
The 6AR presents the following overview of the reduction potentials
3. Future Demand and Net Zero Targets
Industry – Future Energy Demand –
In the World Energy Outlook (WEO2024) , the IEA examines energy use in a number of sectors under its standard scenario based on current global policies (referred to as the Stated Policies Scenario – ‘STEPS’), along with other more advanced emission reduction scenarios. This section will consider the baseline STEPS analysis as follows:
- Heavy Carbon Polluter – The industry sector is the most CO2 intensive use sector with almost half of all consumption related emissiosn (when including the building and energy aspects of consumption).
- Developing World – Notably, 70% of total industrial energy use is concentrated in the developing world illustrating both the major development in this part of the world and the export by developed world of much of its material production, effectively outsourcing its emissions. However because the developing world is ,almost by definition, less financially equipped to implement the advanced technologies required to reduce emissions, this fact can itself have a lock in effect for cheaper but highly polluting heavy industry production.
- Hard to Abate – As earlier noted the industry is a hard to abate sector: some marginal reduction is achieved through the switch from coal to gas production. The share of electricity also increases over time particularly for lighter industry.
- High Heat Requirement – The sector is dependent on high temperature heat to drive the industrial processes which account for almost three quarters of energy use in the sector. However, as the WEO24 analysis reports, the technology options to avoid emissions is not yet in a mature state but are expected to move beyond prototype state in the next number of years.
- Technological Development – WEO24 summarises the current position as follows : many technologies are now advancing beyond the prototype stage: most of them use CCUS and electrolytic hydrogen, but some involve direct electrification, for example, electric steam crackers. Direct electrification is more straightforward for non-energy-intensive industries: around half of the thermal energy that they require is used at less than 100 degrees Celsius (°C) and can be supplied at competitive prices by heat pumps, which can also be competitive at higher temperatures (in the 100-200 °C range). Resistance heating, bioenergy or low-emissions hydrogen are alternative solutions: their growing use plays a major part in reducing unabated fossil fuel use to 20% by 2050 in the APS and phasing it out almost completely in the NZE Scenario’ (CCUS = Carbon Capture Utilisation and Storage ie. commercially using some of the carbon captured).
- Hydrogen – In 2023, global capacity for green hydrogen (water electrolysing) reached 1.4GW, with the capacity in that year matching almost total previous installation. China currently dominates with 80% of all green hydrogen installations. Even excluding very early stage announcements, current deployment commitments on 26Mt of green hydrogen by 2030 is estimated to be 40% of what would be required to cut sector emissions under the ambitious NZE50 scenario.
- Plastics – Despite the failure of the global plastics treaty in 2024 due to veto by oil producing countries, progress is being made at an individual country level with 90 countries partially or completely banning single plastic use. Waste recycling however continues at low levels rising from 12% to current 19% after ten years. But potential to move from mechanical to chemical processing which could substantially increase rates of recycling. Nevertheless there will be a continuing need for ‘virgin’ plastic and oil use for the purpose is expected to remain close to current levels of 12mb/d (approx. 12% of total use). Electrification of steam crackers to produce the plastic is possible and could have a significant impact in this sub-sector.
Industry Net Zero Targets –
The IEA has prepared a landmark Net Zero Roadmap Report (NZ2050) outlining a detailed and viable pathway to zero carbon emissions by 2050 (to keep within 1.5 degrees of warming) which has been taken as an authoritative benchmark for action across all sectors; first published in May 2021 and November 2024 in its current version.
The NZ2050 roadmap presents its evaluations for Industry in a number of related parts which are listed below along with their corresponding total emissions reduction target contributions for each industry sub-sector of note that would enable the world to reach net zero by 2050:
Steel – 6%
Cement – 6%
CCUS -8%
Hydrogen -4%
Primary Chemicals (plastics/fertilisers)- 3%
Bioenergy – 7%
In total, the cumulative emission reduction contributions from all these industry sub-sectors contributes a very large 35% of the total emissions reduction pathway for Net Zero in 2050 under this IEA scenario. The key sub-sectors as considered in this article are highlighted in black abvoe.
Following are some main points related to the earlier discussions:
- Steel – reductions difficult due to high temp requirements. Measures build from slow base to rapid implementation from 2035. Scrap metal recycling moves from one third today to almost half by 2050. Fuel use – CCUS reaches 37% by 2050, and ‘green’ hydrogen 44%, both from zero today. Innovative technologies play key roles.
- Cement – reductions difficult due to carbon content of raw materials and high temp requirement. Clinker to cement ratio falls from 0.71 today to 0.57 by 2050. Hydrogen use (2050) reaches only 9% but CCUS for fossil fuels is 31% with biofuels playing significant role. Requires massive roll out of innovative technology.
- Hydrogen – Announced projects, if realised, achieve by 2030, some 55% of the final 2050 levels which is significant. Green Hydrogen = 59GW (renewable) electricity input in 2030, rising to 3300 GW input in 2050; both enormous electricity capacity demand requirements.
- CCUS – quote: ‘If all announced CO2 capture capacity is realised and the current growth trend continues, global capacity could reach NZE (net zero emissions) by 2030.’ But this would be simply incredible. Figures; from 44Mt CO2 captured today to 749Mt CO2 (x18) by 2030 to 1712Mt (x2 again) by 2035 and (x2 again) by 2050. Phenomenal growth if it can be achieved!
4. Reductions for Net Zero –Challenges and Potentials
It is important to note that the Net Zero 20250 Report is not, unlike STEPS model, a prediction of outcomes in 2030 or 2050 but rather presents a feasible if very ambitious pathway to achieve a defined outcome; ie. net zero emissions by 2050 (with remaining emissions balanced by CO2 removals for net zero).
In order to achieve this outcome it relies on certain positive potentials to support the level of transition required as well as the avoidance or at least successful steering through the likely challenges and pitfalls. These will be briefly considered in the following sections as they relate to the Industry sector, derived from the IEA reports as well as IPCC 6thAR.
Industry Emission – Reduction Challenges –
Competitiveness issues – The technologies are still at early deployment levels of technical development meaning they will start very expensive and could be several decades before substantial scale and ‘learning’ savings are achieved. A critical question is what is the policy driver that will incentivise the deployment of these largely cost additional factors and where identified as appropriate, will Governments actually implement them? Ideally this will be done at a unified global level so that early implementers are not penalised by the higher cost of deployment.
Location issues – Due to the need in the case of CCUS to transport and store the captured CO2 and in the case of electrolytic Hydrogen the needs for large amounts of renewable electricity; heavy industry sites should should also be sited close to suitable locations for each. However this may not match where they are currently sited so that careful planning would be required to match the emission mitigation model to the industry siting and for transportation etc to be economically viable from that location.
Secondly and more fundamentally perhaps, as most heavy industry is now located in developing countries where access to finance is more difficult and costly, in order to achieve the relevant levels of emission reductions required for Net Zero, it will be essential to support the level of investment needed in developing countries to support the deployment of these advanced and expensive technologies. This could come through a global carbon price, though that is not on the horizon yet, or from the Carbon Credit markets which were revitalised by the adoption of the Paris Agreement operating rules at CoP29 in November 2024 but the scale of support required is enormous.
CCUS Deployment – Lower rates of deployment than envisaged. Although the already announced projects seem to be large number, The WEO24 states only 19 Mt CCUS capacity is in the pipeline for 2030 which is only 7% of what is needed in the NZE scenario. There is also an apparent discrepancy here between what the NZ2050 report indicated and what is actually happening, but it is the case that many early proposals are made and the majority fall away without being developed to completion. This is a critical risk factor not only for the CCUS envisaged reduction contribution, but also for the whole Industry strategy many of which sub-sectors relying on this technology due to the hard to abate nature.
Development time and Lock In – Both the NZ2050 and the 6thAR Reports both highlight danger of investment decisions being made now with current available technology which is not sufficient to meet the industrial net zero reduction requirements and which could lock out the new technology that is anticipated to come on stream over the next decade, particularly as this new technology will be more expensive and therefore a more difficult commitment to make.
IEA Energy series indicates that the next investment cycle will have an enormous impact on the trajectory of emissions from industry for the next 3 decades and it is essential that the development are at a minimum retro-fit ready for when the new technologies are available. Less than that would put at risk the deployment. However the IPCC points to intermediate investment cycle where retrofits, retirement and refurbishment decisions present real opportunities to upgrade, particularly where these are supported by strong regulatory mandates and/or a strong Carbon price.
Industry Emission – Reduction Potentials –
Light Industry – this presents a much more easily grasped opportunity, relative to heavy industry for decarbonization particularly with the use of electrification (assuming that the electricity is progressively produced by renewable energy sources). WEO24 indicates that around half of the thermal energy required for non-energy intensive (‘light’) industries is less than 100 degrees Celsius and can be supplied competitively by heat pumps or direct electricity sources.
Green Hydrogen – Whilst the CCUS deployment continues, even after decades of attempts to disappoint in terms of the number of projects successfully deployed, the pipeline delivery for Green Hydrogen (electrolytic Hydrogen utilising renewable energy) appears to be much further advanced. With China committed, if it follows a similar trajectory to its development of renewable energy or electric vehicles, performance for this technology seems very hopeful. This is aligned with the high cost reductions in solar power generation and the abundance of energy, indeed excess solar energy in some hotter locations which would make them ideal locations for the location of green hydrogen production facilities.
With improving technology, it is also possible that electrolytic renewable energy produced hydrogen could take the place of stalling CCUS, at least in theory. However as this requires dedicated plant design, the challenge is that sufficient plants are developed in advance which utilise hydrogen based technology – making that decision comes with certain risks and uncertainties as to actual future hydrogen production outcomes; the classic chicken and egg scenario.
Carbon Pricing – While the US handled the issue of competitiveness related to new low carbon technologies through subsidies under the Inflation Reduction Act which may be under threat from President Tump’s opposition to the clean transition. Meanwhile the EU has forged ahead for now at least by introducing the Carbon Border Adjustment Mechanism (CABM) alongside stringent new regulatory controls as well as the Emissions Trading Mechanism (ETS) extension to heavy industry which are both carbon tax measures effectively, in order to protect cleaner industry producers from these competition concerns.
The challenge will be to broaden such protections, incentives and measures to the rest of the world, particularly as we have seen earlier, the developing world. The CABM and the gradual removal of free allocations for heavy industry in the ETS is already having some pushback. However China has also introduced an ETS which is a hopeful sign for the peaking and plateauing of Chinese industrial emissions. This alone would result in major step step forward in light of the fact that China is by a long way the largest producer of heavy industry cement and steel products.
5. Article Reference Links
- IPCC 6TH Assessment Report – Working Group III: Mitigation of Climate Change – Chapter 11 – Industry
6. Recent Posts and News Links
Climate Junction
Recent News Links
- Global plastic pollution talks have stalled – but a treaty is possible if countries can agree on these three things –The Conversation – Dec 2024 –
- World Cement: ‘There has to be a financial benefit for doing the right thing’ Energy Monitor – Aug 2024
- How CBAM threatens Africa’s sustainable development – Energy Monitor – Nov 2023
- Decarbonising cement: Why the hold-up? Energy Monitor – Jul 2023
- Steel can reach net zero by early 2040s – study – Energy Monitor – Jun 2023
- Oil companies are ploughing money into fossil-fuelled plastics production at a record rate – new research – The Conversation – Nov 2021
MCL – April 2025 (next update schedule: Spring 2027; more regular updates in the ‘Latest News Section’).