Context – Sectors- Transport
Content:
- Emissions and Energy Profile –
- Developments
- Future Demand and Net Zero Targets –
- Emission Reductions – Potentials and Challenges –
- References
- Recent Update Posts and News Links
(Article Note – All references used in the Article are listed at the end of the article. Direct quotations are indicated in italics with emphasis highlighted in maroon.)
1. Emissions and Energy Profile
As the IPCC most recent 6th Assessment Report: Working Group 3- Mitigation of Climate Change (6AR-WG3) indicates in the Chapter 10 on Transport, any attempt to meet climate mitigation goals requires transformative changes in the transport sector covering passenger road, aviation, trucks, trains and shipping. Transport together makes up more than one third of all CO2 emissions from end use sectors, second only to the energy sector. The purpose of this Context article is to outline the current position and future direction, the global Net Zero by 2050 emissions targets and the opportunities and challenges in meeting those goals.
The 6th AR-WG3 indicates that in 2019, the last full year pre-Covid19, total transport related greenhouse emissions were 8.9Gt CO2e ( Gt = Gigatonne = billion tonnes; e= equivalent = all greenhouse gases converted to equivalent CO2 warming potential). The chart below shows a stead emissions growth rate of 1.7-1.8% per year from 2000 with road transport making up 69% of that volume and total aviation making up 11% (international 7% and domestic 4%).
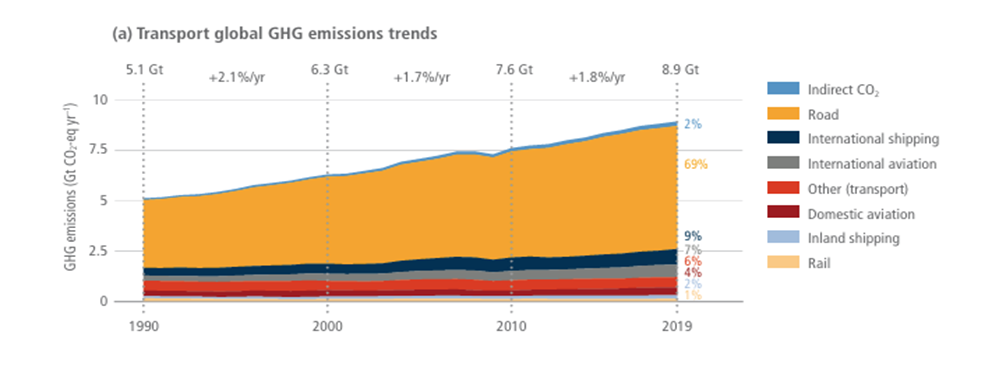
Focusing on CO2 only (ie. not including other greenhouse gases), the IEA in its Energy Series –Transport indicates that this grew to nearly 8Gt CO2 in 2022 which represented growth rate of 3%; much of the growth coming in aviation rebounding from collapse in Covid-19 years.
In terms of global share World in Data shows for 2021 figures, that transport emissions was led by US at 1.66Gt followed by China at 0.97Gt, the EU at India is next a long way behind at 295 Million tonnes (Mt) with Russia (250Mt), Brazil (200Mt) and Japan (183Mt) following.
2. Electric Vehicles – Developments
As the IEA’s World Energy Outlook 2024 (WEO2024) states, electric vehicles (EVs) are the primary means to decarbonise the road transport sector, by far the largest sub-sector and carbon emissions.
Over 17 million EVs were sold in 2024 according to Rho Motion making it a record year and representing a 25% increase compared to 2023. Following is a snapshot taken from rho motion:
- Global: 17.1 million, +25%
- China: 11 million, +40%
- EU & EFTA & UK: 3.0 million, -3%
- USA & Canada: 1.8 million, +9%
- Rest of World: 1.3 million, +27% (large jumps in Brazil, Indonesia, Mexico)
Total global car sales in 2024 were 74.6 million units (a 2.5% increase compared to 2023) which means that EVs represented sales of 22.9% of total car sales in 2024. Total EVs on the road is still only about 5% which will gradually increase as more EVs are sold and older fossil fuel vehicles are retired.
Some region/country related observations from the above figures:
- EV Types – the Rho Motion report does not provide a breakdown of the electric vehicle types but IEA WEO24 indicates that for 2023 of total global vehicle sales were – 12% battery electric (BEVs), 10% engine hybrids and 6% plug-in hybrids (PHEV)
- China dominates with over 64% of total global EV market in 2024. Most of the sales growth in China was for PHEVs at 81% while BEVs were 19%. PHEVs sales were supported by the range extender electric vehicles (REEVs) which improves the electric range of the hybrid to approximately 150km compared to plug in hybrid electric vehicles (PHEV) with a range of only 65km, before reverting to petrol. Sales in China were supported by generous trade- in terms subsidies by the State.
- EU – sales in Europe were deflated by the significant reduction in sales in Germany following the ending of subsidies in 2023. The EU has a number of policy measures that should drive up again sales across the region.Currently policy is 100% CO2 free vehicles by 2035; has come under pressure but remains official policy. In meantime, stringent CO2 standards coming into effect has a strong incentivising effect on car manufacturers.
- US – The tax credits on EV purchases (up to $7500 per new EV, $4000 for used) in the US introduced under the Inflation Reduction Act clearly helped sales. However this and the Environmental Protection Agency’s emission standards which incentivised manufacturers to promote EVs are under threat from President Trump and could suffer the same collapse as happened in Germany however several of the measures introduced remain at point of writing operational and having an impact, perhaps because the measure directly supports US.
- UK – Sales in the UK were up 20% in 2024 to almost 400 thousand helped by the zero emissions vehicle mandate incentivising manufacturers.
New Labour government in 2024 reinstated the earlier commitment to end all fossil fuel new car sales by 2030 and hybrids by 2035.
- Norway – In Norway EV sales has reached 90% of the total market, the highest in the world supported by subsidies
- India – electric mobility promotion scheme, subsidy scheme for electric 2 and 3 wheelers
- Japan – targets 100% EVs/hybrids by 2035.
3. Future Demand and Net Zero Targets
Transport – Future Demand
The IEA in the WEO2024 provides the following estimates as part of its analysis of current and committed new policies, referred to as the Stated Policy Scenario (STEPS):
- By 2030, annual EVs (all types, BEVs and hybrids) reach sales of 40 million units globally. This is more than doubling from todays figures which is a stretching estimation and means that nearly 50% of cars globally sold are EVs.
- These estimates are considered to be reasonable and broadly in the middle of the range for other estimates to 2035. There has been some scaling back by manufacturers on short term production as demand has not quiet met estimates but the longer term plans are on course for well over 40 million EVs being produce.
- A likely (‘sensitivity’) range applies of between 40% to 50% EVs by 2030 with key variables being the level of consumer demand which is closely connected to the level of government support as well as the roll out of a reliable network of charging infrastructure. Even with delays on these points in 2030 (which is only 5 years forward) sales would still nearly double from current.
- Global demand for electricity for EV charging increases almost x10 from 115 terra Watt hours to 1000TWH. It amounts to approximately 15% of total global electricity demand in 2030.
- The estimated impact on oil consumption even under this standard scenario is significant: the WEO2024 indicates that the switch to EVs would be responsible on these figures to a reduction of 1 million barrels per day from todays levels in 2030 which would contribute to peaking demand for oil. The total effect would be that almost 10 billion barrels of oil would be displaced by EVs avoiding over 4GT CO2 in that period.
Transport – Net Zero Targets
The IEA has prepared a landmark Net Zero Roadmap Report – A Global Pathway to Keep the 1.5C Goal in Reach (NZ50) outlining a detailed and viable pathway to zero carbon emissions by 2050 which has been taken as an authoritative benchmark for action across all sectors; first published in May 2021 and November 2023 in its current iteration.
The NZ50 roadmap presents its evaluations for transport in two parts: Road transport and Shipping and Aviation.
Road Transport
For road transport, NZ2025 envisages a contribution of 16% of total emissions reduction from this sector by 2050, the second largest contribution after energy. This sector profile is divided into, cars and vans, buses and heavy trucks and presented in the following graphs and tables.
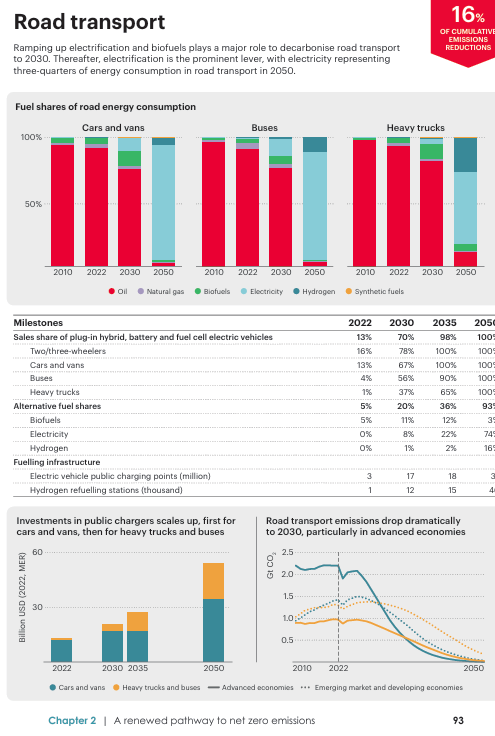
- The first graph show the total vehicles on the road ( not the number of new vehicles) so the change to 2030 appears slow but reaches almost 100% electric by 2050. While the table below that represents cars sold and indicates by 2030 that EV car sales would be two thirds of total (67% compared to 50% in the STEPS scenario). Biofuels have an established position of 12% by 2030 but actually fall steeply by 2050 reflecting the decisive move to electric.
- On this profile, the impact on annual CO2 emissions reductions are dramatic, starting in 2025 with year on year steep progressive emission falls to reach zero emissions by 2050 for road transport, by far the largest sub-sector currently.
- Public chargers make an initial big jump, from just 3 million globally in 2022 to 17 million by 2030 with a more gradual rise after that date when the focus for charging and switches to ramp up for electric buses and heavy trucks after 2030 also reaches 100% by 2050.
- Transport energy consumption switches under this NZ50 scenario from 90% oil today to 80% in 2030 and the same for EV electricity demand from 1% of total fuel share to almost 8% by 2030 and reaching 74% by 2050 with 16% envisaged for hydrogen. The slow build is due to the gradual replacement of the existing fossil fuel car on the roads as new EVs replace existing petrol cars.
- For Aviation and shipping, the total contribution for emission reductions to zero by 2050 is also notably large at 5% total emissions reduction contribution.
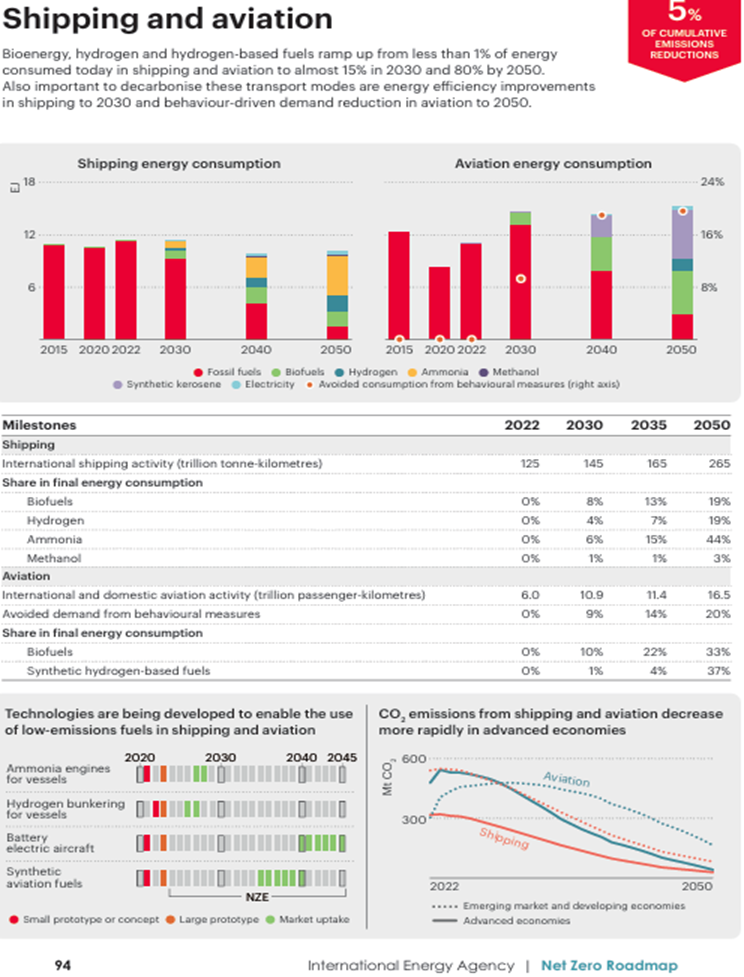
- The focus here is on alternative fuels to fossil fuels but with extremely limited role for electricity with instead synthetic kerosene and biofuels leading the charge for aviation and ammonia and hydrogen for shipping.
- The difficulty of decarbonising these sectors is reflected in the slower and incomplete transition to new fuel types by 2050, even under this stretch ambitious scenario. By 2040 over half of the fuel type for both shipping and aviation is still fossil fuels but in the following decade that rapidly transitions, particularly in the case of aviation.
- The role of avoided consumption is a very important one in this scenario for aviation though can be easily missed from the above chart – it is represented by the red circle on the right axis. These indicate that behavioural changes are important elements for emission reductions (ie less frequent flying) accounting for 8% reduction 2030 up to 20% in 2040 and remaining at that level to 2050. It is not clear if this is absolute avoided consumption (ie. actual reduction on flights ) or relative reduction to what would otherwise occurred if that behaviour change hadn’t happened, but writer’s view is that it is likely the latter.
4. Emission Reductions – Potentials and Challenges
It is important to note that the NZ50 Report is not (unlike the STEPS model) a prediction of outcomes by 2030 or 2050 but rather presents a feasible if very ambitious pathway to achieve a defined outcome; ie. net zero emissions by 2050 (with remaining emissions balanced by CO2 removal).
In order to achieve this outcome it relies on certain positive potentials supporting the level of transition, as well as the avoidance or at least successful steering through the challenges and pitfalls that are considered possible. These will be briefly considered in the following sections as they relate to the Transport sector, taken from the range of IEA reports as well as IPCC 6AR.
Transport Emission Reduction Potentials
- Battery technology – cost and range–
The single most significant driver for the uptake of EVs, and with it the prospects for the scale of CO2 emission reductions envisaged by the NZ2050 scenario, is the plummeting cost of EV batteries. The IPCC in its 6thAR published in 2021 indicated that battery costs had fallen to $150 per kWh which it claimed on a whole life cycle basis made EVs cost competitive with petrol cars and were expected to fall to $100 or possibly even $80 by 2030. In fact as the WEO2024 reports, battery costs have fallen to $80 already in 2024!
This level of reduction this has already resulted in many of the major manufacturers reducing their prices substantially: Chinese car makers have reduced by around $1,600 in 2023 and are already 60% below the fossil fuel equivalent there. It indicates that EU car makers are planning a wide range of new models in 2025 for under $28,000, well within the range of conventional vehicles and the 2024 Dacia Spring is offering this new model for £14,230 with a stated range of 140 miles designed primarily for urban driving.
Meanwhile the battery range, based on energy density continues to increase even as costs fall. All this is underpinned by the rate of technological advancement with research focused on next generation cathode and anode materials and scalable manufacturing processes and recycling.
IEA Energy System reports that the first commercially available sodium ion battery was which was only in early stage development (TRL4 ) some years ago. While the range is currently shorter than lithium based batteries, it is important marker in the diversification of battery composition to other mineral bases, in this case the very abundant sodium element. Battery innovation and manufacturing as discussed in this comprehensive analysis by IEA is a model example of successful technological and commercial enterprise Trends in electric vehicle batteries – Global EV Outlook 2024 – Analysis – IEA
Transport Emission Reduction Challenges
- Cost –
The cost of EV batteries as noted above have fallen significantly, and with this the costs of EVs has been reduced by $10,000 in the US for example as reported by IEA. However most EV models still remain about $10,000 – $15,000 above their fossil fuel equivalents with a perception that EVs are for wealthier people although on a whole life basis, they are actually cheaper than petrol only alternatives (when fuel, maintenance, depreciation and incentives are factored). Nevertheless, it is clear that the relative cost profile of purchasing a new EV needs to continue to fall significantly (suggested 25% further reduction) particularly for medium range vehicles to make the large inroads by private buyers into the convention car market necessary to build momentum.
- Regulatory Mandates –
We have seen earlier the impact that the ending of subsidies had in Germany with sales falling steeply in 2024. With President Tump declared opposition to electric vehicles and threat to end the $7,500 tax credit (though which has not yet been removed despite the blizzard of other executive orders), this could have a similar but deeper impact in the US combined with the commitment to remove the EPA emission performance standards. Reducing state EV supports both in terms of subsidy and regulatory controls could significantly weaken EV take up and slow the momentum towards EV as the default option for cars which is necessary to achieve the NZ2050 goals. Again the cost profile is critical; any reduction in subsidies would need to be offset by technical reduction in the EV price.
- Consumer Opposition –
Buyer sentiment is an intangible but critical factor in the transition from fossil fuels to EVs. However EVs have from the start faced consumer resistance often influenced by hostile sections of the media that latched onto earlier technical limitations including low range, battery performance in cold weather, depreciation and need for expensive replacement of batteries along with direct misinformation regarding their climate credentials and safety records.
Many of problems with earlier versions have being resolved in more recent versions particularly relating to the increasing EV ranges between charges but the negative perceptions can remain, particularly when linked to the so called ‘culture wars’ which has drawn climate action into the frame. This is particularly potent when combined with populist politics (as in the US and to some extent in Germany and the UK) and withdrawal of prescriptive mandates and removal of subsidies. Significant counters to this is the continually improving technical specifications of EVs and the falling costs but it remains to be seen if these are sufficient to maintain the necessary momentum against negative campaigning and mis-information so characteristic of the culture wars .
Charging Infrastructure –
Repeatedly a key determinant for consumer confidence is sufficient, available and well located charging points. In general, the number of charging points is increasing even as the battery ranges improve but with the surge in EV sales, the number of charging points still lag behind what is required causing ‘range anxiety’. However as reported by SMMT, the current average EV range of 236 miles in the UK this should become less of an issue for many drivers. However this issue or at least the perception of lack of range and lack of charging stations will be an important factor to address for the successful roll out at the scales envisaged by the NZ50 Report.
Range is also something that is in fact dependent on the use profile of individual car owners; with many city drivers willing to sacrifice range for cheaper models while more expensive models – it is therefore crucial that the different driving profiles is adequately taken account
Conclusion
Ultimately the success of the EV take-up must stand on its own merits. With costs falling and technical issues being resolved, including much greater ranges at lower prices, there is every chance that EVs will win substantial the technical argument, at least enough to counter the negative perceptions, negative press coverage and anti EV policy.
But whether that is enough to also drive the massive up take required to make a dent in the previous monolithic position of the fossil fuel powered internal combustion engine remains to be seen. Only if it does so can the ambition for road transport emission reductions be achieved. Cost and consumer confidence are the two key aspects as seen from the above analysis.
5. References
IPCC 6TH Assessment Report – Working Group III: Mitigation of Climate Change – Chapter 10 – Transport
Our World in Data – CO₂ emissions from transport
World Energy Outlook 2024 – Analysis – IEA
Over 17 million EVs sold in 2024 – Record Year – Rho Motion
Transport – Energy System – IEA
Net Zero Roadmap: A Global Pathway to Keep the 1.5 °C Goal in Reach – Analysis – IEA
MCL – April 2025 (next update schedule: Spring 2027; more regular updates in the ‘Latest News Section’).