Context – Science- THE Greenhouse Effect
(Note –All references used in the article are indicated and linked in the article. Direct quotations are indicated in italics )
Contents:
- The Greenhouse Effect
- Common Greenhouse Gases (GHG)
- The Carbon Cycle
- Climate Sensitivity
- Links to other Climate Context Articles
- Latest News Links
1. The Greenhouse Effect
The basic concept that the earth’s atmosphere might keep the planet warm was first introduced about 200 years ago by Joseph Fourier who used the analogy of the greenhouse to describe the effect which has been used ever since. It is this greenhouse effect that keeps the earth at an average 15C temperature which, without the effect would drop to -18C by what is termed the Stefan Boltzmann Law.
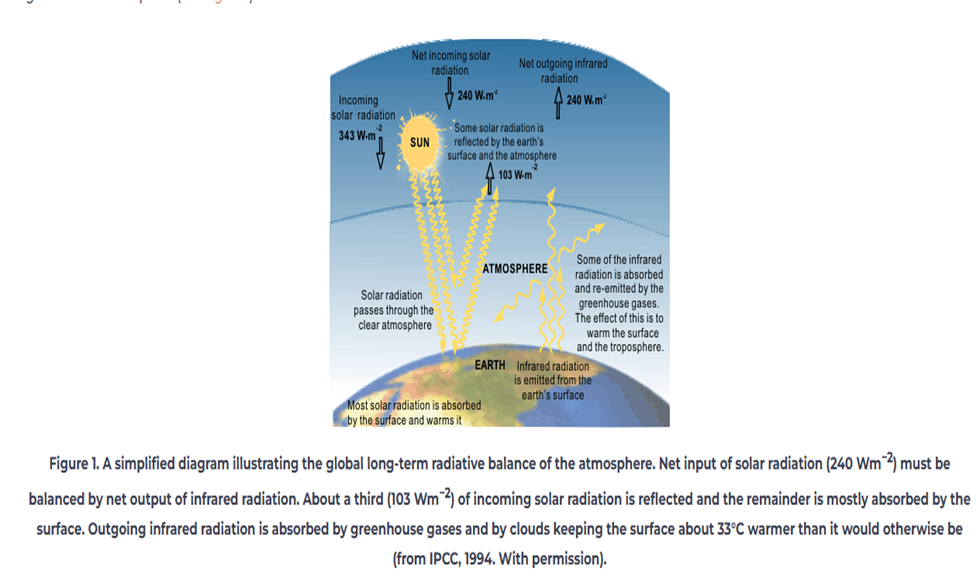
While the atmosphere does not entrap the air as a greenhouse does, the analogy does accurately explain how shortwave solar radiation (sunlight energy) penetrates the atmosphere which is then absorbed by the earth surface and emitted back out as long-wave infrared radiation energy. Approximately 30% of the sunlight is first reflected back to space by clouds aerosols in the atmosphere and other reflective before reaching the earth’s surface; 20% is absorbed in the atmosphere and 50% actually reaches the earth. Some of the energy reaching the earth surface is returned to space as long wave infrared radiation, some of which is trapped in the atmosphere thus maintaining an energy balance as well as helping to keep the earth warm as illustrated in the following diagram from thermopedia .
Most of the atmosphere is in fact made up of nitrogen (78%) ad oxygen (20%) neither of which gases absorb radiation. However as first identified by the Irish scientist, John Tyndall in the 1860s; other gases in the atmosphere such as CO2 and water vapour absorb the thermal radiation due to their more complex molecular structure which actually creates the earlier mentioned greenhouse effect. Tyndall found in his experimentation that coal gas (methane or CH4 in chemical formula) acted like a virtual sponge for infra-red light (heat).
Greenhouse Gases –
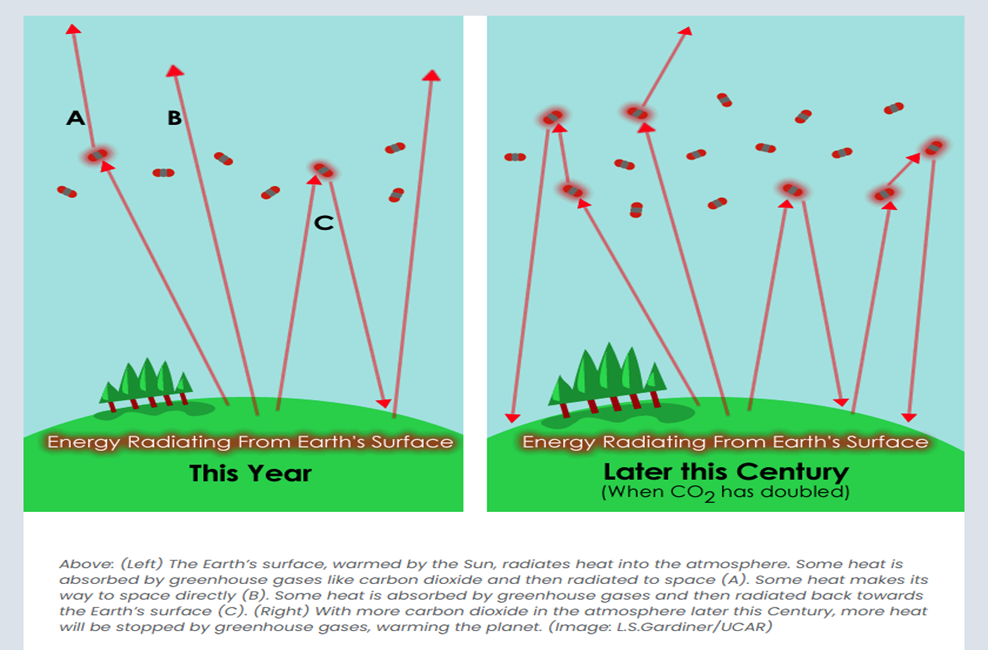
Greenhouse Gases are the gases that actually absorb the reflected long wave radiation as it is reflected from Earth. The broader the absorption profile of a gas, the more wavelengths it can absorb and the stronger its effect. The following diagram from The Center for Science Education illustrates the impact of the small amounts of a greenhouse gas can have and how that impact changes with increased but still relatively small atmospheric volumes:
Any changes in the atmospheric composition of these gases has a direct impact on the heat balance of the earth, either increasing or reducing the retained energy – this effect is termed radiative forcing which can be either positive or negative and is measured in Watts per square Meter. It is the increasing emissions of these greenhouse gases since the start of the industrial age from burning of fossil fuels and particularly accelerating in the past 50 years that has been the principal driving force of global warming and climate change. All greenhouse gases are well mixed which means they disperse evenly throughout the atmosphere and have similar volumes at any point on the globe.
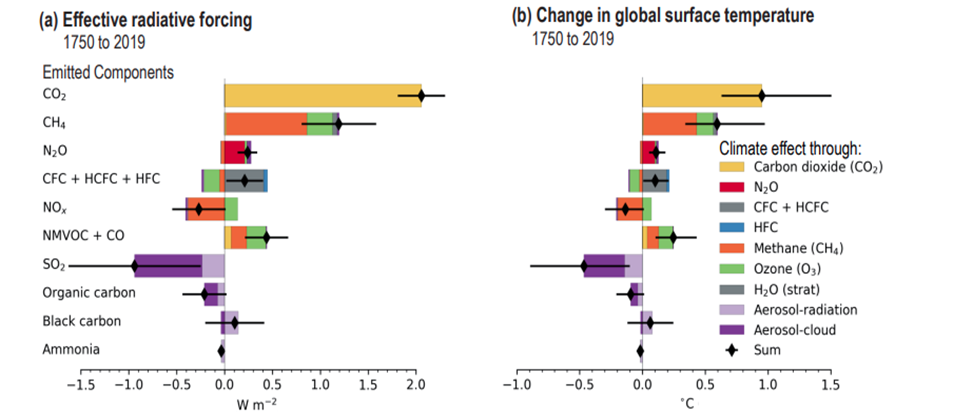
The following diagram taken from the IPCC’s 6th Assessment Report, Working Group 1 – Climate Change 2011: the Physical Science Basis (6thAR-WG1)Technical Summary (page 92) illustrates the radiative forcing on the left and the corresponding temperature change attributed to the component GHG emissions on the right:
2. Common Greenhouse Gases (GHG)
Following is an account of the GHGs which are most common and also cause the most global heating:
Carbon Dioxide (CO2)
Carbon dioxide accounts for 82% of GHG emissions. Although only a small fraction of the atmosphere (0.04%) , this gas has a large effect on climate. At the start of the industrial age, the CO2 quantity in the atmosphere was 270 parts per million (‘ppm‘) which has increased steadily, more recently at a rate of approximately 3ppm per year to reach the current 427ppm; which is a rise of 157ppm or 58.3% in that time.
Each 1ppm volume in the atmosphere is the equivalent of 7.8 billion/ Giga tonnes (Gt) of carbon dioxide (or 2.3 Gigatonnes of carbon as 3.67 Gt of carbon dioxide = 1Gt of carbon – this can get a little confusing as some articles refer to Carbon Dioxide and some refer to Carbon – but the above conversion rate always applies ). As explained in the above linked Skeptical Science article; because 55% of CO2 emissions are actually absorbed in natural sinks (ocean ad biosphere), the airbourne fraction of CO2 emissions is 45% so that 1PPM of atmospheric concentration is actually the equivalent of 17.3Gt CO2 emitted. On this basis, humans have introduced to the atmosphere since the start of the industrial era approximately 2,716 Gt of Carbon Dioxide in the period.
This gives some idea of the scale of emissions which is directly relevant to calculations of the carbon warming budget. The fact that this increase is caused by humans and not from other sources is indicated by the unique isotopic fingerprints of carbon from fossil fuel burning.
The other key factor related to CO2 is its long atmospheric residency meaning that according to NASA, it can stay in the atmosphere anything from between 300 to 1000 years so that once released in the atmosphere it will continue to impact the climate over many human generations – therefore it is the cumulative volume of CO2 in the atmosphere which heats the planet rather than the additional volume added in any particular year.
As can also be seen in the above IPCC diagram, the GHG impact of the accumulated CO2 in the atmosphere is the largest by a significant margin with a radiative forcing of 2 W/m2 and approximately 1C of warming to 2019 attributable to this GHG alone.
Because of the central role that Carbon Dioxide plays, as the US EPA site explains: other GHG emissions are often measured in carbon dioxide equivalent (CO2e). To convert emissions of a gas into CO2 equivalent, its emissions are multiplied by the gas’s Global Warming Potential (GWP). The GWP takes into account the fact that many gases are more effective at warming Earth than CO2, per unit mass.
Methane (CH4)
Methane is a powerful greenhouse gas which is the second largest contributor to global warming after carbon dioxide – as shown in the above IPCC diagram. To date the radiative forcing effect of Methane is 0.7 Watts per meter and a heating contribution of 0.3 degrees and so is responsible for between 20% and 30% of total global heating since 1750.
Methane is present in the atmosphere at much smaller volumes and is consequently measured in parts per billion compared to carbon dioxide. However an individual methane molecule has a much more powerful heating impact (global warming potential ) compared to carbon dioxide, up to x86 times that of carbon dioxide over a 20 year period or x28 over a 100 year period – the reduction over time is because because methane has a shorter atmospheric existence of around 12 to 17 years before breaking down and it is considered for this reason to be a ‘short lived climate pollutant’.
Although natural sources are significant, for example from lakes, peat bogs and other natural habitats, human activity has caused over 60% of methane emissions, the majority being from agriculture, particularly cow belching and rice paddy fields (40%) but significant amounts from leakage in oil drilling and coal and gas extraction, transportation and storage (35%) as well as landfill and other waste sites (20%) .
Methane emissions have doubled since the start of the industrial age and are continuing to grow at a fast rate and although there is substantial uncertainty related to the total volumes it is recently estimated at 570Mt from all sources.
Because of its powerful warming impact but short lifespan, action to reduce methane emissions would have an immediate effect with a period of decades and its curtailment is essential to limiting warming to 1.5C degrees.
Manufactured Gases –
Fluorinated gases ( formulas – HFCs, PFCs, NF3, SF6) are gases that do not occur in nature but are created by human industrial processes for example in refrigeration (HFCs) and production of aluminium and semiconductors. Although their presence in the atmosphere is in minute amounts compared even to methane, their GWP is enormous – for HFC it is 12,400 and has a significant atmospheric residence of 270 years. Other forms have such as PFCs can remain in the atmosphere for up to 50,000 years.
Although also occurring naturally, nitrous oxide (N2O) is another gas emitted by humans over a range of activities including manufacture and use of fertilisers (mostly) and burning of fossil fuels. The GWP for N2O is 265 over a 100 year period and the lifetime is 114 years. Emissions of N2O have been steady or reducing slightly as emission and design standards develop.
Water Vapour –
It is actually water vapour that directly contributes the most to Earth’s greenhouse effect at 50%, carbon dioxide in comparison contributes 20%. However the vapour remains in the atmosphere for only 9 days and continually recycles through evaporation and precipitation. It is also highly variable from barely any to saturated at up to 3% of the air compared to only 0.04% for carbon dioxide. But as carbon heats the atmosphere more moisture is retained in the air which amplifies the warming effect of water vapour creating the significant water vapour feedback effect. As Nasa states:
‘ So while carbon dioxide contributes less to the overall greenhouse effect than water vapor, scientists have found that carbon dioxide is the gas that sets the temperature. Carbon dioxide controls the amount of water vapor in the atmosphere and thus the size of the greenhouse effect.’
Clouds also have complex and difficult to calibrate impacts; with some having a negative forcing effect, reflecting light back to space whilst others have a net positive forcing effect, reflecting light back down to earth. Our understanding of the complex but important role that clouds play in global warming is only gradually becoming clearer.
3. The Carbon Cycle
Carbon actually cycles through natural reservoirs; from rocks to the ocean to the atmosphere, soil, plants and fossil fuels and back. As described by NASA The Carbon Cycle there is a slow carbon cycle that operates over millions of years and involves chemical weathering of rocks that form carbonate minerals in the oceans, settle as sediment at the bottom of the oceans and is re-captured in rock formation through tectonic action such as volcanos which also releases CO2. It is this slow carbon cycle which has acted as Earth’s thermostat regulating CO2 levels in the atmosphere and hence global temperatures over earth’s long history.
The fast carbon cycle operates on much shorter timescales from days to hundreds of years. This cycle involves the rapid exchange of carbon through the atmosphere, oceans, and living organisms. Photosynthesis plays a key role, with plants and phytoplankton absorbing CO₂ to produce energy, and releasing it back into the atmosphere through respiration, decomposition, and combustion.
The following diagram from the article illustrates both the slow and the fast cycles of carbon:
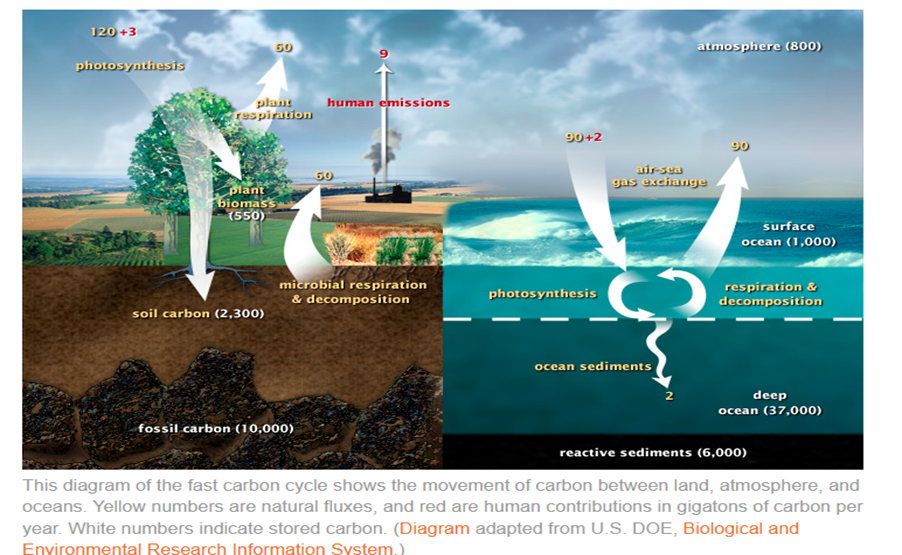
Human activities, particularly since the Industrial Revolution, have significantly altered the carbon cycle. Burning fossil fuels and deforestation have accelerated the transfer of carbon from the slow cycle (stored in rocks and fossil fuels) to the fast cycle, increasing atmospheric CO₂ levels. This rise in greenhouse gases has led to global warming of over 1.5 degrees in 2024 compared to 1850-1900 average. Even if all emissions stopped today, there is also a committed warming of approximately 0.6 degrees due to time lags in carbon sinks release to the atmosphere.
The atmosphere has taken approximately 45% of this additional carbon, the oceans have taken 30% and the land 25%; the latter two are referred to as natural sinks. Any reduction in these natural sinks would result in an increased atmospheric storage and have a corresponding increase in warming rates which is a major concern addressed in the IPCC 6th Assessment Reports and many other recent reports and articles.
Whilst the ocean provides this critical service in absorbing large volumes of carbon emissions, it does so at a cost of acidification as the carbon is dissolved in the water increasing its acidity and negatively affecting the ecosystem from tiny shelled plankton at the base of the food chain to vast stretches of coral reefs essential aquatic nurseries.
4. Climate Sensitivity
One critical factor in climate science is to determine the impact a given amount of carbon dioxide emissions has on temperature/ climate warming which is termed climate sensitivity. It is defined as the heating that would result from a doubling of atmospheric carbon dioxide and is a crucial metric for understanding the Earths response to greenhouse gas emissions and predicting future climate change. There are two types of climate sensitivity:
- Equilibrium Climate Sensitivity (ECS): The long-term (centuries to millennia) temperature change after CO₂ doubling, including the long slow climate feedbacks such as ice sheet melt and deep ocean warming.
- Transient Climate Response (TCR): The temperature change over a shorter timescale (decades to a century) following a gradual CO₂ increase, relevant for near-term climate projections.
While the ECS is clearly of importance in the longer term and is very likely higher than the TCR it is the TCR that gets most attention due to the immediate impact on the climate system.
The Intergovernmental Panel on Climate Change (IPCC) provides estimates of climate sensitivity based on observational data, paleoclimate records, and climate models. The 6thAR-WG1 refined the likely range of ECS to 2.5–4.0°C, with a best estimate of 3.0°C.
As regards the TCR, the IPCC 6thAR-WG1 Technical Summary indicates in TS 3.2.1 (p93) that:
Based on process understanding, warming over the instrumental record, and emergent constraints, the best estimate of TCR is 1.8°C, the likely range is 1.4°C to 2.2°C and the very likely range is 1.2°C to 2.4°C. There is a high level of agreement among the different lines of evidence (Figure TS.16c) (high confidence).
These ranges are among the most critical data reported in all of the Assessment Reports as they give us the best estimates of both short and longer term heating responses from our carbon emission pollution. These ECS and TCR values are higher due to evaluated increased net cloud feedbacks of about 20% compared to previous IPCC assessments.
5. Links to other Climate Context Articles
The Climate series of Context articles will continue to explore some of the basic aspects and issues of climate change science in the following article links:
Context – Climate Modelling – Introduction
Context – Carbon Budgets for Warming Thresholds
Context – Paleo-Climates – Warnings from the Past
MCL – April 2025
(next update schedule: Spring 2028; more regular updates in the ‘Latest News Section’).