Context – Countries – Developing Countries including India
Contents:
- GHG Emissions Profile
- Energy
- Energy, Environmental and Climate Policy in Developing Countries
- Climate Action Tracker Evaluation
- Recent Posts and News Links – Developing Countries
1. Developing Countries –GHG Emissions Profile
Developing Countries – Lower Middle Income region focus
- The World Bank divides the countries of the world into different regions based on income and the following chart displays these regions from High Income though Higher-middle and Lower-middle Incomes to Low Income. The trajectory of energy development and carbon emissions in the middle and lower income countries will be a key factor in determining the global pathway in term of emissions and global warming, whether it is possible at a global level to become carbon neutral by 2050 (as required to stay within ‘safe’ warming levels) as these countries catch up with the higher income (‘developed’) world.
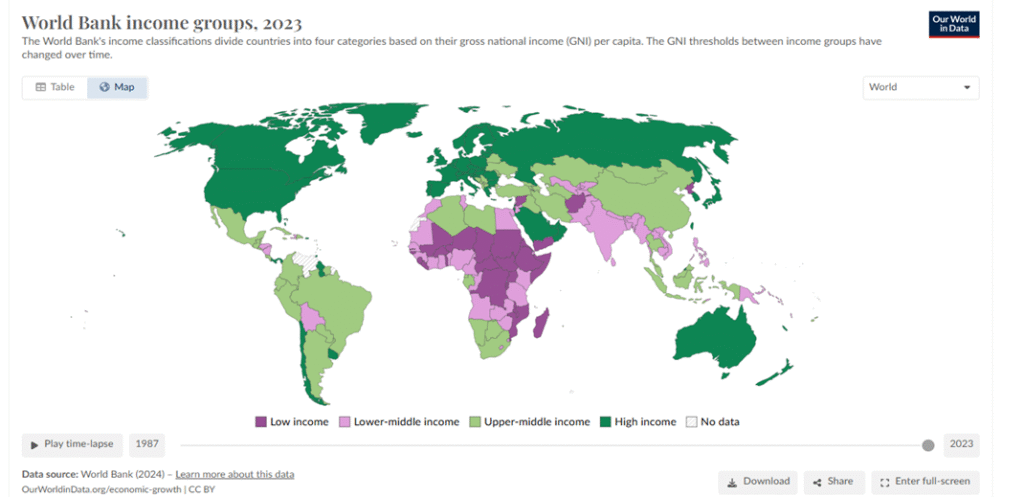
- The focus of this Context Article will be on the Lower Middle Income region, countries with gross national income per capita of between $1,146 -$4,515, which includes India, Pakistan, much of South East Asia (but not Indonesia, Malasia Thailand – upper-middle income countries), Nigeria, Egypt, Kenya and Tanzania; all high population countries with this region containing 40.27% of the global population (3.19 billion) compared to 8.88% for low income countries and 35% for higher-middle income countries (incomes of between $4,516 to $14,005 per head). China, by far the largest population in the middle-high income countries region is covered in another Context article- China while this article will also look in particular at the energy profile of India; the one other country with a population of over a billion people but on at a more recent development pathway compared to China.
Focus Countries Total Emissions Profile –
- The following graph indicates the growth of carbon emissions by sector in the Lower-Middle Income region overall. As can be seen from the graph, emissions in this region have increased broadly in line with the rest of the world over the past 20 years approximately reaching a total of 6.97 Giga (billion) tonnes CO2 equivalent for all greenhouse gases (GtCO2e) in 2021. This figure is almost double the amount in 2000 (3.75Gt) rising to 5.23Gt in 2010 but still less than half of the emissions of China (13.5Gt in 2021) or of the United States. However it is on a per capita basis, that the true disparity in emissions is most stark with the US emitting 17.75 tonnes per person average, China emitting 10.94 tonnes while lower middle income countries per person emissions are in the range of: Nigeria – 0.58 tonnes, India- 1.81 tonnes, Pakistan – 1.02 tonnes, , Egypt 2.38 tonnes; all several times less than developed countries or indeed China.
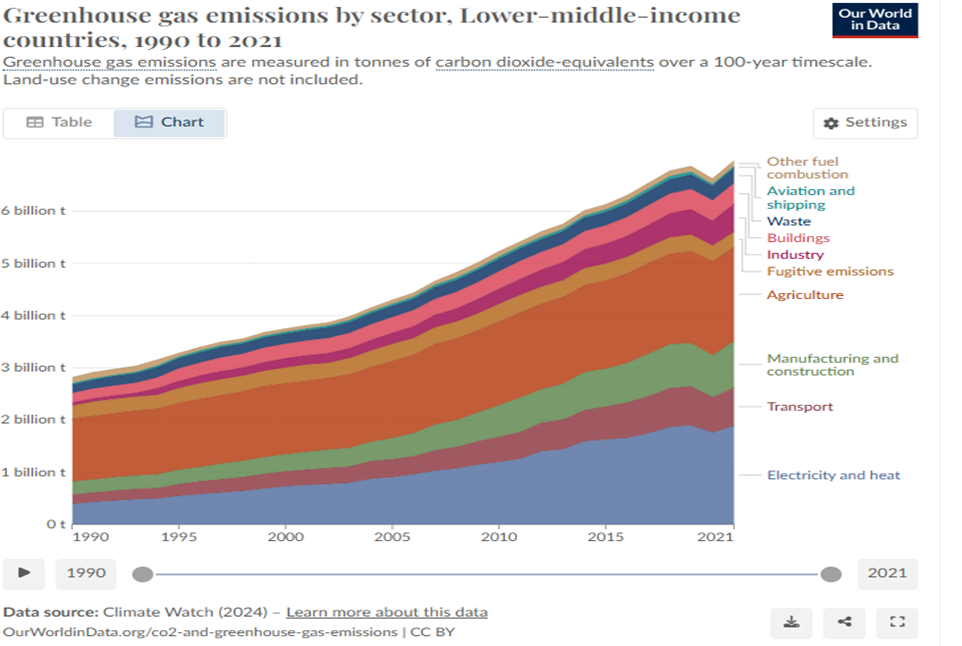
- The second most striking element in the above chart is the sectoral share of emissions with Agriculture coming a close second to electricity and heat (25.93% to 27.1% respectively). In low income countries this lead is even more pronounced with agriculture making up 62% of total but very low emission profiles while in high income countries the share for agriculture is one of the smallest sectors at 7.03% again reflecting the disparity of the relative stage of economic development in the various regions. For India, electricity and gas sectors has grown a little faster than other low-middle income countries accounting for 35% compared to 21% for agriculture as the country develops and its emissions profile grows.
2. Energy
Electricity Production –
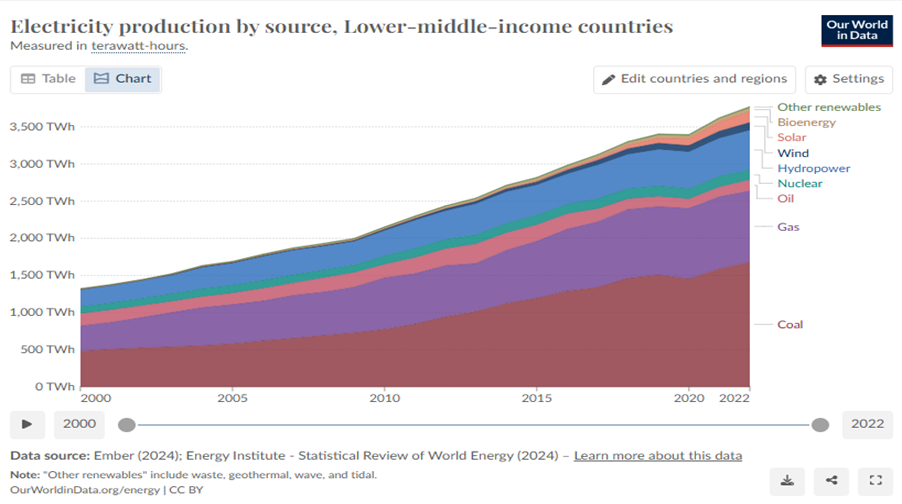
- Coal burning plants provide the largest share of electricity generation in lower-middle income countries in 2023 with 1,681 Terra Watt hours (TWh) in 2023 (43.8%) followed by gas power at 958TWh (25%) which is actually in excess of global average gas share of 22.5%. That relative share of gas has remained stable across the last decade. As the carbon emission intensity of gas is substantially lower than coal (200 vs 363kg CO2 per 1MWh), this relatively substantial share for gas power generation in lower-middle income countries is actually a positive indication of potential cleaner development pathways away from coal.
- However it is the future trajectory for electricity demand that is of importance as these economies continue to grow. This is particularly the case as the total electricity consumed in all these countries together, 3774TWh in 2023, is still substantially less than half of the electricity consumed in China (9,460TWh) although this income region has over 3 times the population of China (3 to 1 billions approximately) suggesting that electricity demand has the potential to grow massively in the coming decades. What sources predominate this new generation will be of major significance, whether coal, gas or renewables, to the emissions profiles of these countries.
Renewable Energy
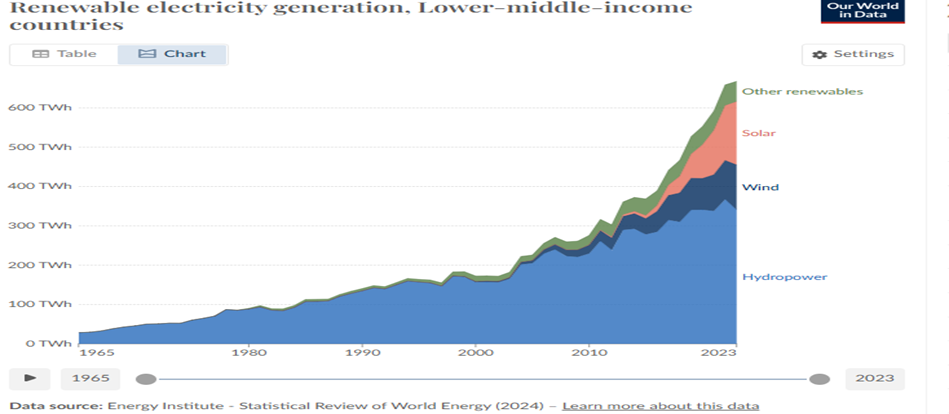
- Looking at renewable energy, the predominance of hydroelectric power is immediately clear and has provided approximately 14% of total electricity consistently for the last decade, growing as overall electricity demand increases.
- As may be seen in the graph below, hydropower was effectively the only renewable source of energy up to 2005 approximately when wind and other renewables (not traditional biomass) started to make an appearance. Solar started to make an appearance from about 2015 and has grown relatively rapidly to provide 160 TWh of power or just under a quarter of total renewable energy whist wind has grown in the same period to provide 17% of renewable energy.
- India as a lower-middle income country has led in this surge of renewable power and is cited as both the 3rd largest consumer of electricity as well as being the 4th largest renewable energy producer in the world at 405TWh. In fact, renewables are currently growing faster in India than any other major economy according to the IEA and is on track to double new renewable capacity additions by 2026. Solar generation capacity grew from just 3GW in 2000 to 70GW in 2023 (IRENA 2023). In 2023 approximately 20% of India’s electricity came from renewables, even as its total electricity generation doubled since 2010. However that is in a context where coal power predominates, providing 75% of total electricity in 2023 and actually increased from a figure of 68% in 2010. This heavy dependence on coal has led India to become the third largest GHG polluter in the world, at 3.394 Gt of CO2 eq, again demonstrating both the huge importance of developing countries in terms both of their emissions as well as future sources of electricity power growth.
3. Energy, Environmental and Climate Policy in Developing Countries
- A core principle in the Paris Agreement, the landmark 2015 global climate agreement, is that of ‘common but differentiated responsibilities and respective capabilities’ (CBDR-RC) to recognise the significant differences in economic capacity and historic responsibilities for GHGs and their reduction. In the energy context, the CBDR-RC principle essentially means that peaking of emissions will take longer for developing countries and these countries are entitled to receive assistance, both financial and technical, to help make the transition from carbon emitting fossils to renewable energy sources.
- As seen at the most recent CoP29 in Azerbeijan in 2024 however, the call to build up assistance to £1.3 trillion in annual funding assistance was watered down to a offer to fund $350 billion by 2035 which is a fraction of the funding required of $6.7 trillion per year as a global figure according to IRENA in its 2024 report. It reports that of the $570bn invested in renewable capacity additions in 2023, over 150 poorer countries representing over half the world’s population received only 10% of that investment.
- In particular the 2024 IRENA report has identified investment costs as prohibitive in many developing countries due to perceived development risks involved in and therefore a significantly higher costs of capital. It suggests new sources of finance are needed such as a wealth tax to fund a just and equitable energy transition to be distributed on a needs based principles. The irony is that places like Sub Sahara Africa, with the most severe electricity access deficits (up to 50% in several including low and low-middle income countries) are also the places with the most abundant renewable energy resources but cannot harness the potential due to lack of funding and technologies.
- Nevertheless and despite the obstacles, progress is possible as India has demonstrated. For example, Kenya, Ethiopia and Ghana have achieved electrification rates of approximately 75% or higher (IRENA 2022). Combining electricity access targets as well as clean energy objectives, the African Development Bank has identified mini-grid and small off-grid as pivotal solutions for rural areas.
- In India, access to electricity increased from only 56% in 2001 to nearly 99% of the population by 2020 which was an enormous achievement considering it is now the most populus country on the planet. It also achieved 70% of the National Solar Mission adopted in 2010 for 1000 GW of solar capacity by 2022 was achieved. But again the big question remains for India as well as for all other developing countries, how will the almost inevitable leap in electricity demand be generated; will that be predominantly from coal and gas or can renewables step in to meet that future demand. As noted above, access to adequate funding will be a key factor in providing an answer to that question.
4. Climate Action Tracker Evaluation
- Each year the Climate Action Tracker (CAT) evaluates the climate commitments of countries against a number of standards, the headlines one being the Countries alignment to the Paris Agreement goal of limiting global warming to well below 2 degrees and as close to 1.5 degrees as possible and the likelihood of the achievement of the particular commitments of the country to reducing emission (Nationally Determined Commitment – ‘NDC’).
- The overall CAT rating for India is: highly insufficient reflecting its high dependence on coal which it notes reached a record high in 2024. Nevertheless in what must be a major achievement for the country, it notes that 46% of its total installed capacity is non fossil based and well on track to beat its NDC target of 50% ahead of schedule. There has been an almost doubling of renewables investments in India (83% increase) and reducing costs, including solar plus storage, are beginning to significantly undermine fossil generation with coal power falling to below 50% for the first time ever. So despite the negative overall appraisal, there are good prospects for the future renewables trajectory in India.
- Other related India targets are rated in the 2024 report as follows:
- NDC unconditional target – insufficient – needs substantial improvement to be consistent with 1.5C as a fair share of global efforts.
- Policies and Action – insufficient – while renewable generation capacity is at 44%, actual renewables generation is only 18% The National Electricity Plan 2023 provided for a temporary halt to coal deployment but the in-construction capacity already exceeds the stated thresholds.
- Net Zero Target – poor – announced at CoP26 as a 2070 goal but evaluated as poor in terms of the detail of the commitment.
M Leech – January 2025 (next update due: Spring 2027; more regular updates in the ‘Latest Posts and News Section’).
5. Recent Posts and news Links – Developing Countries
Climate Junction
General News Links
- African nations unite on Nairobi Declaration (ft.com) – Oct 2023: Leaders across the continent say a rethink on financing from developed nations would speed up the move to net zero –
- How to get pension funds to invest in renewables in Africa (Energy Monitor) – July 2023