Context – Countries – China
Contents
- GHG Emissions Profile
- Energy
- Energy, Environmental and Climate Policy in the China
- Climate Action Tracker Evaluation
- Recent Update Posts and News Links – China
1. GHG Emissions Profile
- China is ranked as the 1st most greenhouse gas (GHG) emitting country in the world discharging 15.9 gigatonnes of CO2 equivalent (CO2e) in all greenhouse gases (GHG) in 2023 (one gigatonne = 1Gt = a billion tonnes). This is over twice the United States’ GHG figure of 6Gt which is second highest global emitter and represents a full 30% of the total global emissions. However on the basis of emissions per head of population (per capita) China is ranked in the 30th world with 8.3 tonnes of CO2 eq per person which is well below the United States ( ranked 13th at 14.3 tonnes per person) but ahead of the global average at 6.59 tonnes and for the first time ranked ahead of the EU at 7.27 tonnes CO2 eq (55th in the world).
- One of the most difficult aspects to adjust to when considering China is the sheer scale of size compared to any other country, both in term of GHG emission and energy demand growth as well as the scaling of clean energy sources and more recently the move to electric vehicles. However because of the size of the country’s emissions, the scale of its clean energy implementation both to date and planned means that China will continue for sometime to be the largest emitter. But the speed and scale of that transition in China matters perhaps more than any other one individual country in terms of the global GHG emissions trajectory with the possible exception of India with its similar population of over 1 billion people but with relatively only a fraction of its emissions currently.
- The graph below indicate China’s GHG emissions growth overall and by sector from 1990. The first thing that strikes is the sustained growth in emissions from 2000, approximately when China started its modern industrialisation and development programmes, from a baseline of approximately 4 Gt CO2, almost trebling in ten years to 11 billion tonnes approximately by 2010. The rate of increase significantly levelled off from approximately 2012 before rising gain post Covid to its current levels of 15 billion tonnes per year.
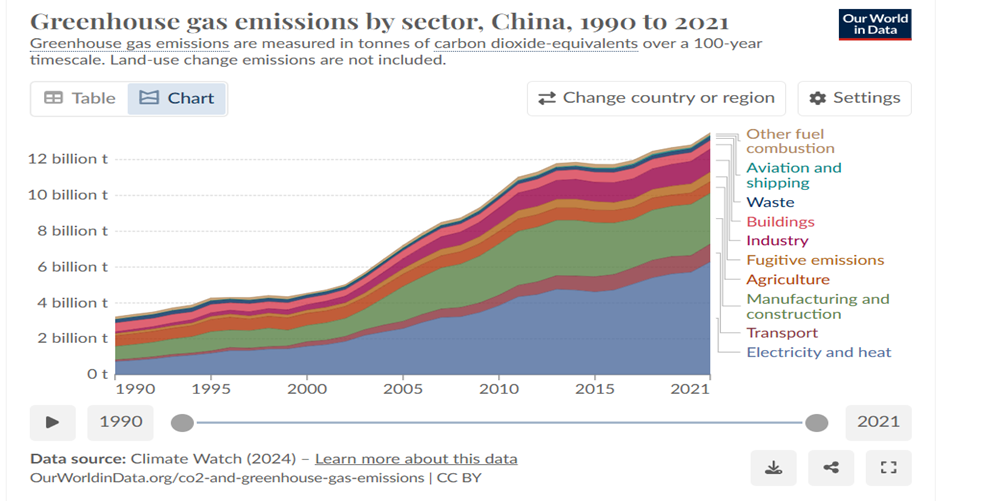
- The second thing that stands out is the domination of the electricity and heating sectors in their GHG contribution by a wide margin followed by the manufacturing and construction sectors: electricity and heating contributed 35% and manufacturing and construction contributed 20% of total emissions in 2000, these relative contributions had changed little from 2010 although, in absolute terms, the emissions of all sectors have rocketed as China developed into an advanced, modern economy of 1 billion plus people.
- By 2021 however, whilst the percentage contribution from manufacturing and construction remained broadly the same at 21% (2.84Gt CO2e), the emissions percentage share for electricity and heating grew significantly to 46.59% of the total or 6.29Gt CO2e which is more than the total US emissions combined (the second largest emitter) from the electricity generation sector alone. This is a much higher relative percentage for this sector compared to other developed countries such US, the EU or the UK and as we will see below is accounted for primarily by the dominance of coal generation in its electricity mix.
2. Energy
Electricity –
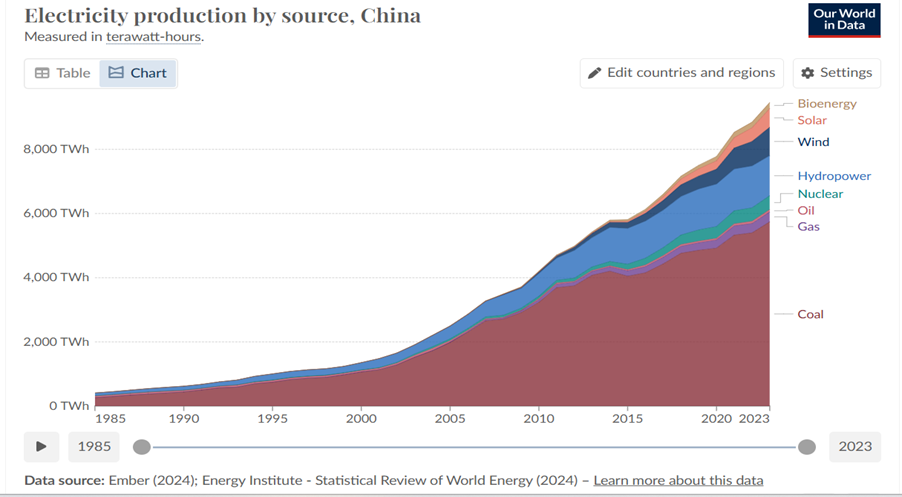
- Looking at the electricity generation profile in the following chart, the very large role of coal becomes clear. Up until about 2015, as electricity demand rose steeply, that demand was primarily led by coal powered generation with a secondary role for hydropower. The role of other fossils, oil and gas was negligible which is markedly different to US, UK and other countries where gas power came in this period to play a significant role. It has been estimated in fact that over the period from 2000 to 2022 that China has added 900GW in new coal power capacity at an average of 40GW per year.
- To put the scale of this in perspective; in 2020, China installed 41GW of new coal generating capacity which represented 74.5% of the global total of 55GW for new coal power that year according to figures provided by Global Energy Monitor and which was not an exceptional year. The scale of this new deployment eased after 2015 but in 2022, a further 106GW of coal power was approved with 50GW of that going into immediate construction. This big jump in approvals arose from energy security and supply concerns which is a national priority, resulting from power outages experienced in 2021 .
Renewable Energy –
- What is not so obvious in the above chart is the enormous strides that China has also made over the past 15 years in development of renewable energy , albeit from a small base. This is better illustrated in the graph below and taking a few figures illustrates the point.
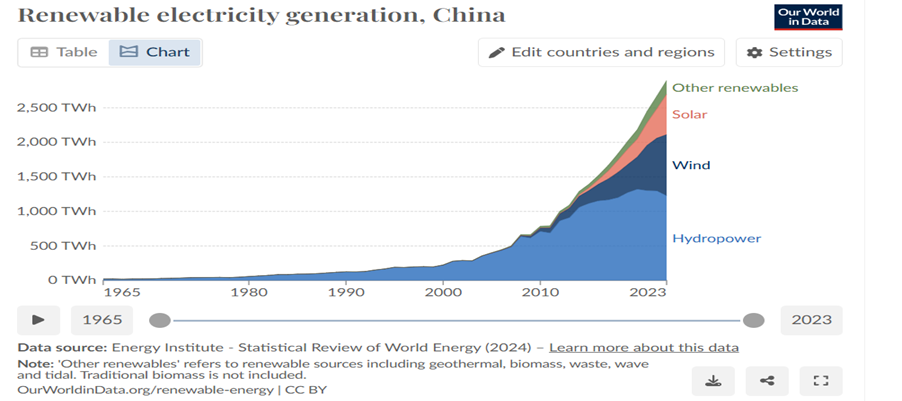
- The figures taken from the data behind the above graph illustrate the scale of renewables development in China since 2010:
| China – New Renewables installed in year (TWh -terra watt hours) | |||
| Source | 2010 | 2020 | 2023 |
| Wind | 103 | 466 | 885 |
| Solar | 3.59 | 261 | 584 |
| Hydro | 688 | 1231 | 1226 |
- As can be seen from the above table, new wind installations increased x4 from 2010 to 2010 and doubled again in the space of three years; solar increased approximately x7 in the same 10 years and again more than doubled in the following three years showing that the pace of installation has not slowed. Hydro only doubled in the ten years but from a higher baseline and in 2023 remained the largest renewables but with the pace of solar deployment that may not last long.
- Total renewables generation in China according to recent analysis by Energy Digital stood at the end of 2023 at 3,749TWh and made up 35% of China’s electricity mix in that year. Nevertheless, the sheer scale of energy consumption in China means that coal still produces almost twice as much electricity as all renewables combined (60.7% or 5,741TWh in 2023). But it is also clear that the overwhelming dominance of coal has been broken and the big question, relevant at a climate change global level, is how long coal dominance will last over the rapid deployment of renewables in China. It is an open question as China pursues a dual goal of energy security (perceived as favouring coal) and clean air, energy and climate (favouring renewables).
3. Energy, Environmental and Climate Policy in China
- China’s main governance framework is developed through its five year plan systems. From the 11th FYP from 2006 to 2010, environmental goals have featured prominently reflected in the growth of renewables, as discussed above, but extending into large scale land protection and forestry measures also.
- The Renewable Energy Law in 2005 established the legislative framework through subsidies and critically mandatory grid integration and in 2021 China established the largest emissions trading scheme in the world starting with electricity but with official plans to extend to steel, cement and aluminium production to cover 40-60% of total carbon emissions in the country. Grid modernisation is another key feature of the country’s climate and energy policy. The big question remains how far the commitment to clean energy sources goes compared to the relatively cheap and well established coal dominated generation model.
- The other critical more recent development in China has been the astounding speed of the uptake of electric vehicles (EVs) which has proceed faster by percentage penetration than most other countries with the exception of Norway and in terms of actual numbers on the road, by many multiples of the next nearest country. This is doubly significant because China’s transport sector is relatively undeveloped (compared to other sectors of the economy) with potential to grow exponentially so it matters a great deal what the energy source of that growth in passenger numbers; whether it is fossil based internal combustion engines or electric vehicles.
- Quoting directly from the Carbon Brief China Review:
- According to a 2021 article from the state-owned People’s Daily, China had by then already been the world’s largest producer and consumer of new energy vehicles for “six years in a row”.
- By 2022, China accounted for nearly 60% of the world’s electric car sales, according to the IEA, which expects the country to retain 40% of the market even in 2030.
- Domestically, there were some 13m NEVs on China’s road in 2022, making up 4% of all registered vehicles, according to official government figures. (The IEA puts the total at closer to 14m.)
- According to IEA, 29% of China’s domestic car sales were electric cars in 2022, up from 16% in 2021 and 6% between 2018 and 2020. The agency says that, as of 2023, EVs “cost less…on average” in China than equivalent combustion-engine cars.
4. Climate Action Tracker Evaluation (2024)
- Each year the Climate Action Tracker evaluates the climate commitments of countries against a number of standards, the headlines one being the Countries alignment to the Paris Agreement goals of limiting global warming to well below 2 degrees and as close to 1.5 degrees as possible and the likelihood of the achievement of the particular commitments of the country to reducing emission (Nationally Determined Commitment – ‘NDC’).
- Despite the huge scale of the renewables and EVs development as noted above China received an over all rating of ‘highly insufficient’) despite the expectation that China GHG emissions will peak before 2023 followed by a gradual decline of 0.5% per year or 1% in the optimistic scenario. With China’s renewable capacity reported as now exceeding coal capacity, its target of renewables total capacity at 1,200GW being achieved more than 6 years ahead of time, with emissions substantially lower than its published NDCs and coal consumption declining it is difficult to understand the negative rating (only one level above its worst of ‘critically insufficient).
- However the negative rating is understandable when China’s huge share of global emissions is factored along with the steps needed to limit global warming to +1.5 degrees: ‘For a chance to limit global warming to 1.5 °C, it is critically important for China as the world’s largest emitter to rapidly decarbonise in the short-term by implementing more ambitious decarbonisation policies in its next five-year plan (2026-2030).’ In order to improve its standing the report indicates that China should; control and reduce fossil fuel dependence, improve the formulation and coverage of its limits by moving from carbon intensity (GDP related) to absolute targets, raise the ambition of its NDCs already achieved and accelerate decarbonisation of high-emitting industry sectors.
- Other related China targets are rated in the 2024 report as follows:
- NDC target – highly insufficient– too lax, overachieving on targets but which allow continued emissions growth
- Net Zero Target – poor – criteria for best practice policy measures not met
- Policies and Actions – Insufficient – unable to meet growing energy demand without expansion of fossil fuel generation
- NDC fair share – Insufficient – 2030 targets need substantial improvement to be consistent with 1.5C temperature limit.
MCL – Feb 2025 (next update schedule: Spring 2027; more regular updates in the ‘Latest News Section’).
5. Recent Updates and News Links – China
Climate Junction – Update Posts
Recent News