Context – Science – Emissions and Carbon Budgets
Contents:
- Carbon Budgets –
- Modelling for Carbon Budgets
- Overshooting Targets and Negative Emissions
- Recent Articles
- Carbon Budgets –
The key feature of climate science is the near linear relationship that has been robustly established between the total cumulative amount of CO2 in the atmosphere and the amount of global warming caused. It also means that a ton of CO2 emitted today or 100 years ago has the same warming effect.
It follows from these key facts that it is possible to indicate for a given temperature, the amount of Carbon Dioxide that may be emitted until that temperature will be breached – this is essentially what a carbon budget is. In other words, the definition as provided by Dr Joeri Rogelj in a Carbon Brief post in 2019 is that:
‘The [Carbon Budget] theory dictates that the total amount of CO2 emitted until emissions are taken down to zero determines the maximum warming that the world will subsequently experience.’
Remaining Carbon Budget – IPCC Estimation
As is notable from the above, it is the cumulative CO2 emissions that count; both the past emissions that are added to the existing natural reservoir of atmospheric CO2 and future emissions up to the point that such emissions stop plus any additional warming due to time lags. One of the key representations in the IPCC reports is the estimate of the remaining budget as taken from the IPCC 6th Assessment Report 2021 – Working Group 1 – the Physical Science Basis (AR6-WG1)– Summary for Policy Makers (Table SPM.2, page 29) copied below:
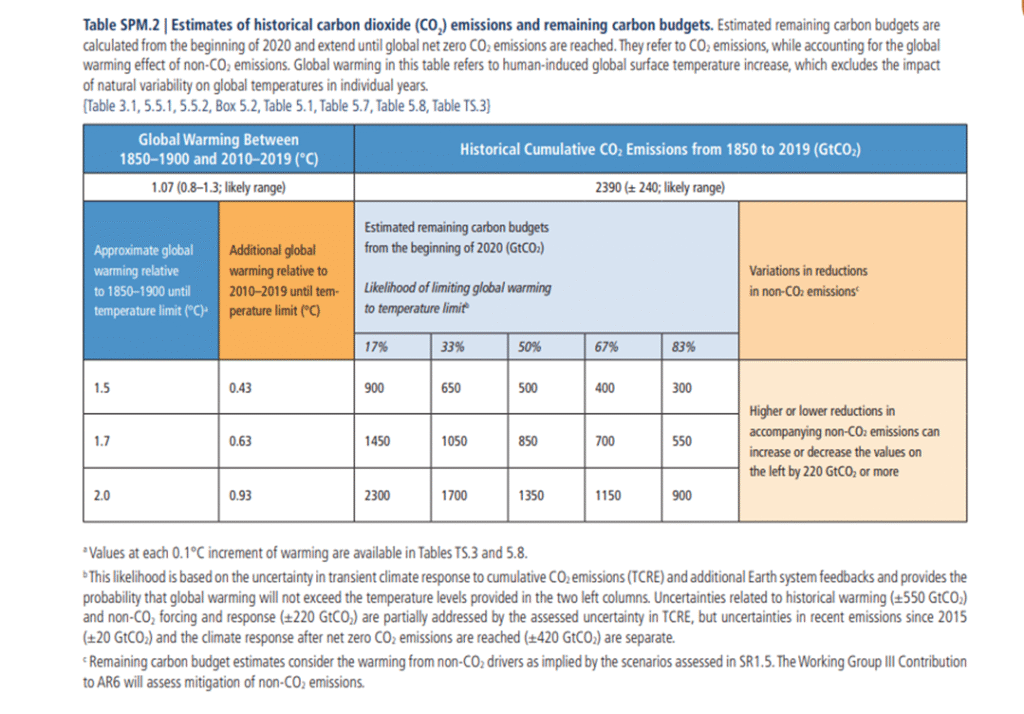
The table provides in condensed format a lot of information and context related to the critical estimations of a carbon budget. The first focus is on the figure of 500 GtCO2 (Gt = gigatonnes = billion tonnes) for a 50% likelihood of remaining within a 1.5 warming limit and 400 GtCO2 for a 67% likelihood. The budgets are given for the start of 2020 and 5 years later as of the start of 2025 these would have reduced by the annual rate of CO2 emissions each year, totalling – 185.68 GtCO2 (2020- 34.37Gt, 2021-36.2Gt, 2022- 36.5Gt, 2023 – 37.01 and 2024 – 41.6Gt). In that 5 year period, the carbon budget for a 67% change of remaining below 1.5 reduced by almost half with about 5 years remaining until the warming threshold is breached, or approximately 8 years for 50% (or 1 in 2 chance) of remaining below 1.5 degrees warming.
For 2 degrees warming a can be seen, the 67% chance has a significantly higher budget of 1,150Gt but that again reduces to below 1,000Gt by the start of 2025. Based on the average CO2 emissions of these 5 years of 37.136 GT per year that would mean a little less than 26 years remaining to breach a 2 degree warming limit assuming current emissions do not significantly decrease or increase.
The budgets are also expressed in percentage likelihoods because of the uncertainties that must be factored where definite amounts cannot be given and footnote b in the above table outlines these variability ranges.
Variances are also provided for the uncertainties in terms of the historic cumulative CO2 emissions from 1850 and in terms of non CO2 emissions (principally methane but also other GHGs) and their possible reductions into the future.
Relative to the small remaining budgets, the range of uncertainties/variables are quiet large, especially for the 1.5 budget estimates with key uncertainties relating to the cumulative historic range of +/- 240Gt, the non-CO2 variable another +/- 220Gt which even in 2020 when the analysis was prepared represented more than 50% of the total estimated budget and the uncertainty level today is actually greater than the total budget remaining!
2. Modelling for Carbon Budgets
Following is an account of some of the complications and complexities and controversies behind these figures and underlying climate models used to calculate the figures. The following account is derived from Carbon Brief explainers and posts except where otherwise indicated.
While simple in concept, carbon budgets has proven difficult with many different calculations previously reaching different results but the range of difference has reduced in recent years as our understanding has grown. It is useful to outline the reasons for these difficulties or uncertainties that have caused such variances as it reflects both on the complex nature of climate change itself as well as the study of it.
Assessment Factors –
The article lists the 5 key factors that account for the variations in the remaining carbon budget for any temperature goal as follows:
- Estimate of global warming to present day – going back beyond reliable observations introduces uncertainty and error
- Assumed warming from other non CO2 GHGs and cooling from suphate aerosols and emissions– methodologies on how these are compiled and calculated are not always transparently presented so cannot be sure comparing like for like between different estimates
- Additional Earth system feedbacks (such as permafrost thawing) – it is clear that in those models that include these feedbacks that the remaining carbon budget is smaller
- The amount of warming still in the pipeline (‘committed’) but not yet manifested at point emissions reduced to zero
- Finally, the key factor of the ratio of cumulative CO2 emissions to the warming response (also known as the transient climate response to cumulative carbon emissions, or “TCRE”).
These are all key factors that have a bearing on the estimates of the remaining carbon budget which is presented in a schematic form in the article which is also used in the IPCC Special Report on 1.5 degrees:
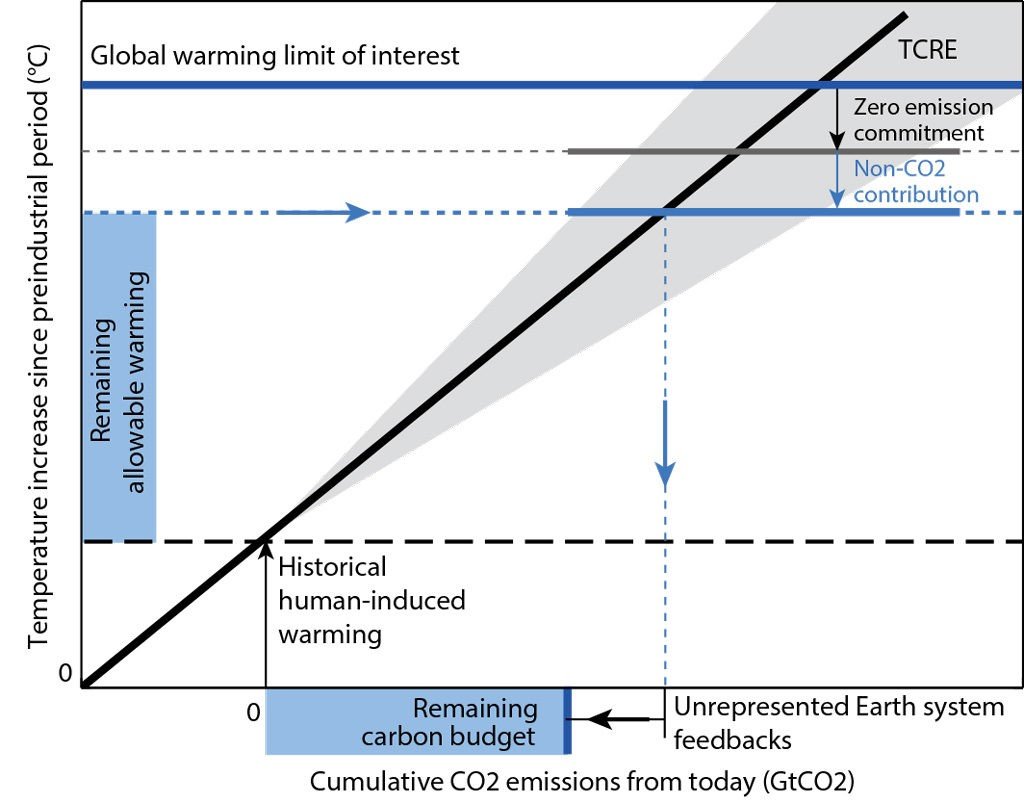
Schematic showing how the remaining carbon budget can be estimated from various independent quantities, including the historical human-induced warming, the zero emission commitment, the contribution of future non-CO2 warming, the transient climate response to cumulative emissions of carbon (TCRE), and further correcting for unrepresented Earth system feedbacks. Source: Rogelj et al. (2019).
Budget Calculations – Including estimation of the factors listed they calculated the remaining carbon budget based on the following key figures:
- Estimated warming of 0.97C from the start of the industrial era – point 1above
- Additional non CO2 warming of 0.1 degrees – point 2 above
- A TCRE in the range of 0.8-2.5C per 1,000 gigatonnes of carbon (3,664Gt of CO2) taken from IPCC 5thAR – point 5 above
- The additional heating ‘Commitment’ following net zero for 1.5 warming was taken as zero – point 4 above
- And a total remaining allowable warming of 0.4C for a global warming limit of interest of 1.5:
- Earth system feedbacks which were not then typically included in climate models due to the uncertainties in their calculations were included roughly to the effect of 100 GtCO2 additional emissions – point 3 above.
Putting all these elements together the resulting carbon budget from 2018 when the calculations was 580GtCO2 to give a 50% change of remaining below 1.5C. This was less than 15 years of global emissions, and at the end of 2024 this would be only 9 years remaining; assuming annual emission rates did not increase or reduce in the intervening years which is broadly correct. The article concludes that the variations on the 1.5C carbon budget are now much better understood and quantified as presented in in chapter two of SR1.5.
Chosen Target Temperatures – Most Carbon Budget analysis provide the global warming limit of interest as being 1.5 degrees and secondly 2.0 degrees of heating. The reason for this comes from the Paris Agreement where the agreed global objective of the Agreement is stated in Article 2.1as: ‘(a) Holding the increase in the global average temperature to well below 2°C above pre-industrial levels and pursuing efforts to limit the temperature increase to 1.5°C above pre-industrial levels, recognizing that this would significantly reduce the risks and impacts of climate change‘
Computer Assessment Models
– A further article in Carbon Brief in 2018 by Zeke Hausfather highlighted that the discrepancies in estimates on the carbon budget calculations do not lie only in the required adjustments and uncertainties arising from the functioning of the earth system but also from the types of computer models that are used to make the calculations. Because Earth System Models (ESM) used are seeking to model complex systems such as the carbon cycles, they may underestimate or overestimate the actual dynamics resulting in the carbon budget for 1.5 degrees in some cases being already exceeded (showing as a negative carbon emissions remaining for that target so that carbon dioxide emissions would need to completely stop and large amounts removed from the atmosphere to achieve the target) while in other models 15 more years remain .
Adding observation data – To counter these biases, some studies have sought to adjust for these biases by calibrating the models from historical data to test and more accurately estimate carbon budget for 1.5 degrees. This actually resulted in a carbon budget of 625 GtCO2 compared to the previous IPCC 5th Assessment Report of 118GtCO2, more than 5 times the size! However the results were immediately criticised because whilst it accurately modelled historic warming, it failed to account properly for the fast warming Arctic region and lacked sufficient detail regarding different surface temperature dynamics (land and sea). When corrected for these discrepancies the resulting budget was 416 GtCO2 and another at 395 GtCO2 which is much closer to the original estimates.
The results are also presented with a % confidence rating – typically either 66% for ‘well below’ the 1.5 heating threshold or 50% for a 1 in 2 chance of remaining below the target.
Integrated Assessment Models – But earth systems are only one aspect; the other being the uncertainty of social and technical development and responses to reduce carbon dioxide – these variances are accounted for in the other type of climate model called Integrated Assessment Models (IAMs) which provide emission pathways or scenarios (low, medium or high emission pathways). Actually, certain results from ESMs are fed into the IAMs to provide comprehensive estimated carbon budgets combined with social and economic conditions, but some key differences in approaches remain.
In ESMs, confidence ratings, say 66%, are basically taken from 66% of model runs to provide the carbon budget figure below the target 1.5%. For IAMs however, the percentage refers to various climate sensitivity values (ie. the range of estimated heatings for a given volume of emissions). Because this sensitivity cannot be exactly calculated, it errs on the side of caution (to a degree of 66% confidence) but which also results in a more cautious and therefore lower carbon budget.
IAMs which featured in the IPCC reports resulted in the significantly lower remaining carbon budget ranges as they account for time lags (the zero emissions commitment or ‘in the pipe line heating’) more strictly than ESMs. They also do not simply measure emissions up to 1.5 and then stop dead as in the case of ESMs which is not realistic and instead adjust down the emissions in the estimation to avoid exceedance of the target again resulting in a smaller budget. Because the amount of the 1.5 remaining budget is so small no matter what model is used (15 years at most on current emission rates) , the calibration and design differences have a big impact on the calculated number of remaining years.
3. Overshooting Targets and Negative Emissions–
The low calculated budget in IAMs models highlights another major issue with climate modelling. The task is typically set to provide the carbon budget to ensure warming of no more than 1.5 degrees in the year 2100. However because as we have seen, this is effectively impossible in all realistic pathways/scenarios – with at most optimistic 15 years remaining until the budget for 1.5 degrees is exhausted; so IAMs carbon budgets do in fact exceed (‘overshoot’) the 1.5 degree target emissions and rely on negative emissions to, literally, extract CO2 from the atmosphere in order to revert back to a mathematically possible carbon budget for the warming target by 2100. Otherwise it would just be simply not possible and we would have to shortly admit defeat for the 1.5 degree warming limit and on current emission trajectories, the 2 degree limit as well in a couple of short decades ahead (assuming feedbacks do not make it sooner that is).
However the scale of the drawdown required in terms of carbon removal from the atmosphere would be enormous. While it is one thing to mathematically calculate the subtraction figure to reach a defined outcome, it is quite another thing to technically undertake that strategy in reality, particularly at the scale needed to bring the emissions equation.
Where there is a shortfall, then the calculations relied on to achieve the goal would be fictional or indeed fantasies where the aim is so farfetched as to never be realistically achievable but where they are used to give a false sense of security to ourselves and do not have to admit the true scale of the predicament we have reached.
Scale of Drawdown
The IPCC 6the Assessment Report Technical Summary indicates with high confidence that human led carbon dioxide removal (as distinct from natural CO2 sinks) such as enhancing biological or geochemical carbon sinks or by the direct capture of CO2 from the atmosphere can work, the benefit is limited by side effects and the further complication that ‘net CO2 removal will be partially counteracted by CO2 release’ from land and ocean stores.
However the actual volumes that would need to be removed are colossal. – the IPCC AR6 Synthesis report at 3.3.4 (page 87) indicates that for every 0.1degree of global temperature reduction, it would require removal of 220 billion tonnes (Gt) of CO2 which is described for modelled climate pathways as limited overshoot – that is approximately 6 years worth of total global emissions! Modelled pathways for ‘high’ overshoot would require removal of 360 billion tonnes of CO. In the subdued tones of the Synthesis Report language it questions the feasibility and sustainability of this approach. Softly stated perhaps but with enormous consequence.
But even if we are justified in our confidence that we will be able to remove the amount of carbon dioxide necessary to return to safer levels of warming (either 1.5 or 2 degrees), a second problem exists: what damage may have been done in the period when the heating overshoots the safe level threshold? The AR6 Synthesis Report indicated that overshooting 1.5 degrees ‘will result in irreversible adverse impacts on certain ecosystems impacted by ice-sheet melt, glacier melt or by accelerating and higher committed sea level rise’.
In the 9 June 2023 editorial in Nature Geoscience, it warns that the duration and the extent of any overshoot would impact on the severity and reversibility of climate damage and illustrates the concept of overshoot in the following diagram:
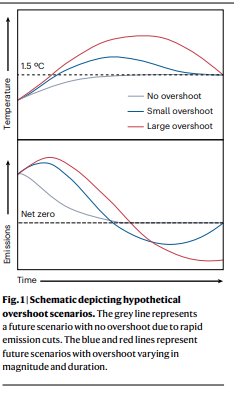
The article goes on to state that ‘even temporarily exceeding 1.5 degrees may increase the risk of crossing climate threshold and tipping the climate into a new state’ highlighting in particular the Atlantic Meridional Overturning Circulation and its ability to abruptly switch off , the Greenland Ice Sheet and its ‘melt-elevation feedbacks and the Amazon rainforest collapse due to increased drought impacts (see the Context section of feedbacks for more content).
The editorial concludes that where the climate targets are exceeded, ‘bringing the average global temperature back down quickly to meet the aim of the Paris Agreement will require concerted, and likely expensive efforts across the globe’. In view of the enormous volume of CO2 that would need to be removed, the short time that is left before we exceed the 1.5 warming limit and the state of development of these CDR methods that would also appear to be somewhat of an understatement. The direct solution would of course be to radially curtail all future emissions.
MCL – Mar 2025
(next update schedule: Spring 2027; more regular updates in the ‘Recent News Section ).
4. Recent Articles
- (605) Beyond the Threshold: The Urgency of Climate Change – YouTube Bulletin of the Atomic Scientists– Apr 2025
- Climate crisis: carbon emissions budget is now tiny, scientists say | Climate crisis | The Guardian – Oct 2023
- How just 25 oil companies are set to blow the 1.5°C carbon budget – Energy Monitor – Jan 2023