Accelerating Danger – Part 1: Is the World Heating Faster than we Thought?
Introduction
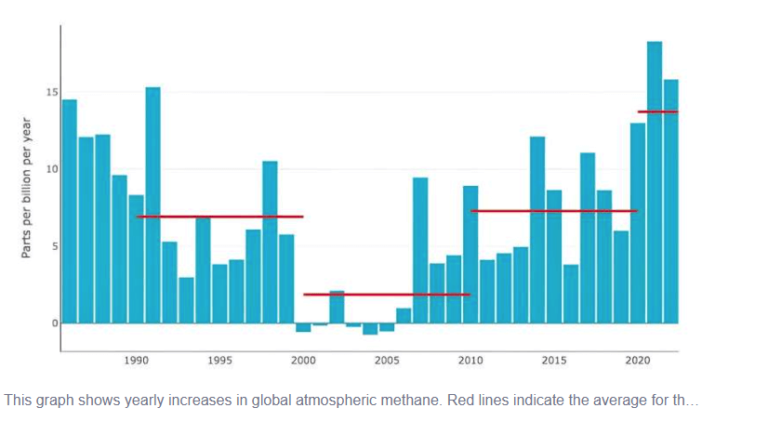
The world is heating — this much is beyond doubt. But scientists are increasingly asking a further, more unsettling question: is the rate of global heating itself speeding up? If so, the foundations of our climate models, and the carbon budgets they underpin, may be shakier than we thought.
In this first of three articles in the series on accelerated global heating, we consider the significance of a potential acceleration in global heating and what evidence exists to show this is actually happening. The second article will consider the possible explanations for any such acceleration and the final article in the series will consider what this may mean for climate change, for climate policy and for all of us in the here and now.
Why accelerated heating is an important issue
There is a very widespread understanding that the world is heating, however hard denialists may dispute the causes of that heating. But what is not so clear and is in fact the cause of much controversy is whether the underlying rate of global heating is getting faster.
The issue is very significant because for the current rate of Greenhouse gas (GHG) emissions (and the cumulative volume of GHGs in the atmosphere), either global warming is within predicted ranges of heating or the predictive power of our climate models and underlying science is failing to take account of key climate factors.
It was always considered as a core of climate science, that there is a known and broadly linear relationship between total GHG emissions and global warming. A relationship which forms the basis for ‘carbon budget’ calculations – indicating how much a certain cumulative volume of total emissions will raise temperatures by and essentially determining how much emissions we can continue to release (the budget) until any particular warming threshold is passed (eg. warming of 1.5C, 2C or other threshold) .
Hence the focus on ‘Net Zero Emissions by 2050’ by the International Energy Agency (the IEA) and now taken up by dozens of governments throughout the world in order to try to keep within heating of 1.5 degrees, notionally at least.
However if this linear relationship of emission to temperature is not in fact correct then the world could be moving faster and sooner to hotter conditions than previously thought – the world would in fact be more sensitive to GHGs than currently understood or expected.
Global Heating – Breaking Boundaries
As the Washington Post recently reported, the UN Intergovernmental Panel on Climate Change (the IPCCC) in its climate science flagship, the ‘6th Assessment Report, Working Group 1 – The Climate Science’, published in 2021, estimated that the planet on current trajectory would not heat by 1.5 degrees Celsius until 2040. But just two years later that estimate was reduced to sometime between 2030 and 2035, now the World Meteorological Organisation in its latest Climate Update expects that that heating threshold would be exceeded in 2028, several years forward; not in one year (that has already happened) but for a sustained duration of several years so the world can be said, to have definitely exceeded that warming threshold.
While every fraction of a degree of warming is significant and has consequences; +1.5C degrees of warming, relative to pre-industrial times, is particularly significant as that is the lower limit of the target under the Paris Agreement and +2C degrees is considered the upper heating threshold limit to avoid dangerous consequences – and we cannot easily go into reverse as CO2 remains in the atmosphere for scales of hundreds to thousands of years. What continue to do now, we must live with the consequences for generations to come!
It is a matter of record that the last number of years were the hottest since records began. There may be nothing unusual in that of itself if you accept the fact that the world is heating, it stands to reason that later years will be hotter than previous ones. But the issue is that the warming was so much higher than anticipated. Words such as ‘absolutely gobsmackingly bananas, “frightening” and “ nearly mind boggling” were used to describe the heating, not typical vocabulary for sober data led climate scientists. One scientist, referring to North Atlantic sea surface temperatures stating that temperature shifts were “literally off the chart”.
But what is the actual evidence to show that the rate of heating is getting faster (ie accelerating)?
A leading scientist in the field, Zeke Hausfather, has examined whether the apparent acceleration is part of the natural fluctuations and variability of the planet. On this approach, we would possibly be too much into short term variability. This happened before, albeit in the opposite direction, when it appeared there was a pause in global warming from 1998 to 2014 (‘the heating hiatus’) which was later established not to be the case at all when short term factors were taken into account.
Hausfather’s analysis involves the examination of 3 separate lines of evidence, each useful in itself and also useful to illustrate the key methods used to measure a heating world.
1. Surface Temperatures (ST)
Looking at the rate of surface temperature warming between 1970 and 2010 and extending that same trend on in time is a good method to determine where temperatures would be if the rate of global warming remained the same. This reveals that in the past decade all but two years, were above that extended trend line and the most recent two years were outside the widest 5-95th percentile range of that trend:
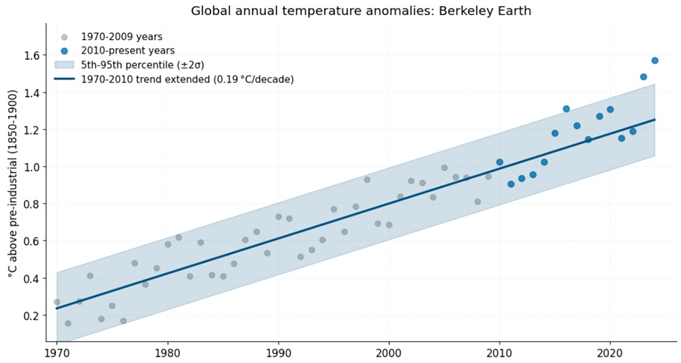
Global annual temperature anomalies from Berkeley Earth, with the 1970-2009 trend and two-sigma uncertainties extended through present.
However, surface temperature measurements are subject to a wide range of short term variances such as the ‘El Nino’ weather events that has just happened in 2023, volcanic eruptions and changes in solar cycle spot activity. The problem is that there is no agreed methodology as to what weight to apply to such factors or how to account for them. This means that the evidence from surface temperature records alone is far from conclusive as to a fundamental change occurring.
2. Ocean Heating Content (OHC)
A more fundamental issue with Surface Temperatures measurements is that they are, as Hausfather states, ‘an imperfect proxy for the actual warming of the Earth system as they represent a relatively small sliver (<5% of the total amount of heat trapped by green house gases’ which makes them so prone to year on year natural variabilities as we have seen.
From this perspective, ocean heat content (OHC) offers a better (though shorter) measurement because over 90% of increased global heating is stored in the sea – this volume of heat and the size of the ocean make these measurements much less susceptible to short term variances. As Hausfather reports, it is indeed the case that OHC has increased steadily every year (as would be expected). But crucially with evidence of acceleration in the warming rate since 2020 and the rate of annual change about 25% higher today than in 2000 (12 Zeta Joules per year added heat compared to 15 Zeta Joules today).
3. Earth Energy Imbalance (EEI)
In the leading Indicators of Global Climate Change 2024: annual update of key indicators of the state of the climate systems and human influence, published in June 2025 by a collaboration of leading climate scientists led by Piers Forster, the Earth Energy Imbalance (EEI) is described as ‘the accumulated surplus energy (heating) in the climate systems and is hence an essential indicator to monitor the current and future status of global warming’.
EEI (illustrated in the NASA video clip here) is a significant scientific concept because it is the actual mechanism which accounts for global warming caused by CO2, methane and other GHG emissions.
CO2 is relatively transparent to most of the incoming shortwave solar radiation but strongly absorbs the outgoing infrared radiation emitted by the Earth, analogous to a thermal blanket trapping the infrared heat.
Excluding major earth system disruptions such as massive volcanic eruptions, up to industrial times, the earth has been in broad energy balance between incoming solar shortwave radiation (the visible wavelengths range) and the reflections back to space of longwave radiation in the infrared section of the spectrum.
However the cumulative, additional CO2 released to the atmosphere, primarily by the burning of fossil fuels, causes more heat to be captured, particularly in the upper atmosphere, and leads to the net energy imbalance and hence warming of the planet.
The Indicators of Global Climate Change 2024 study indicates that in the twenty year period from 1975 to 1994, EEI had an average value of 0.43 watt per meter squared (this may sound small but that is the averaged heat increase for every meter on the planet!). But in latest 20 year period from 2005 to 2025 it reports that excess heat has more than doubled to 0.89Wm2; averaged over a shorter 12 year period from 2012 the rate is higher again at 0.99Wm2.
As Hausfather states, a constant positive EEI indicates a continually warming planet while an increase in EEI indicates an acceleration of heating. Not only has the rate of heating more than doubled on these measurements but, as Hausfather worringly reports, it is increasing faster than estimated in most current climate models.
4. Conclusion
Drawing on these three lines of heating evidence, from surface temperatures, ocean heat content and earth energy imbalance figures, Hausfather reluctantly concludes that there is a clear confluence of evidence of acceleration of global heating in recent years, not just anomaly of the measurements that can arise from surface temperature measurement alone. This means that our climate models must be missing some key relevant factor as they do not account for this increasing rate of heating. So what could this be?
Accelerating Danger, Part 2 – Unmasking the Drivers of Acceleration
What lies behind this acceleration? Are we seeing the fingerprints of natural climate cycles, or something deeper — a shift in how Earth responds to greenhouse gases? In the next part, we’ll look at some competing explanations.